
Manual Session
Overview
Live Device Interaction Powered by WebRTC
A Manual Session in RobusTest gives you direct, real-time control of a physical device through your browser. The session uses WebRTC for low-latency screen streaming and bidirectional device control — no plugins or local setup required.
Supported Platforms:
- Android phones and tablets
- iOS (iPhone)
- Android TV
- Samsung Tizen and LG webOS smart TVs
Key Features:
- Real-time device screen via WebRTC peer-to-peer streaming
- Touch, gesture, and keyboard input from your browser
- Platform-specific controls and debugging tools
- Session sharing for live collaboration
Starting a Manual Session
Step 1: Login to Device Lab
Login to your Device Lab instance.
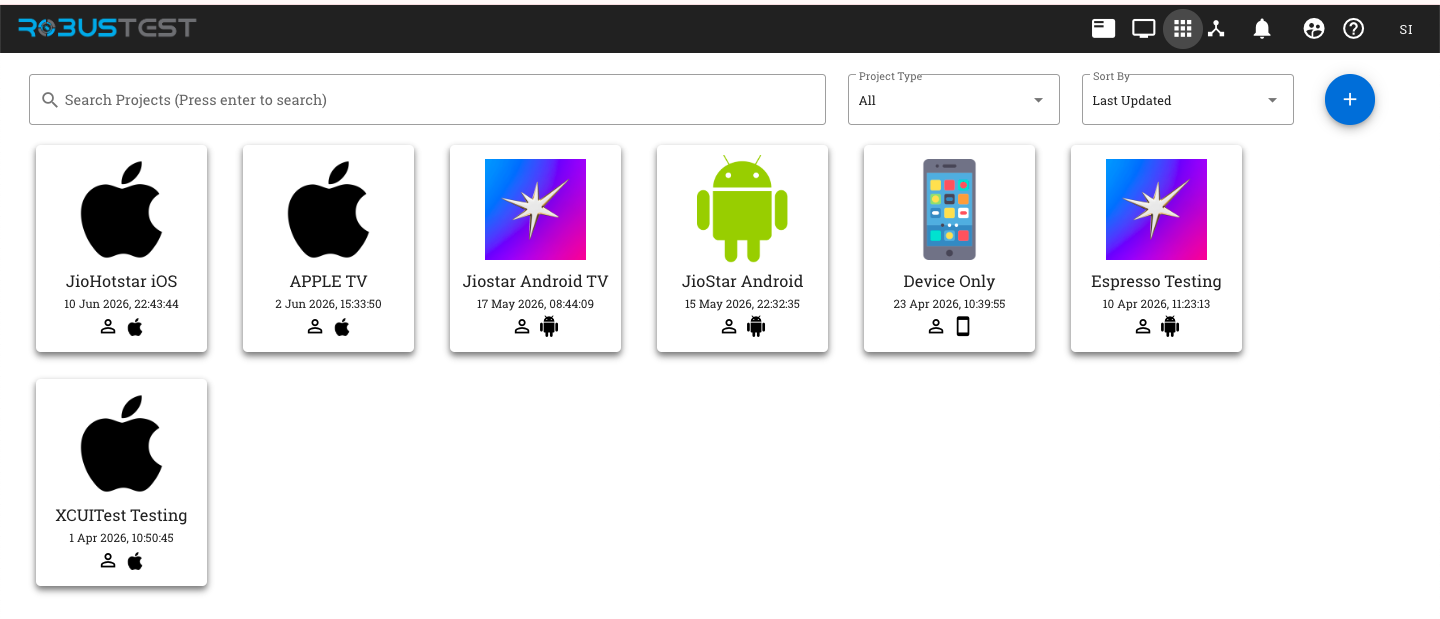
Step 2: Select a Project
Select the project in which you want to initiate a manual session. From the project homepage, click Manual Session to begin setup.
Step 3: Configure the Session
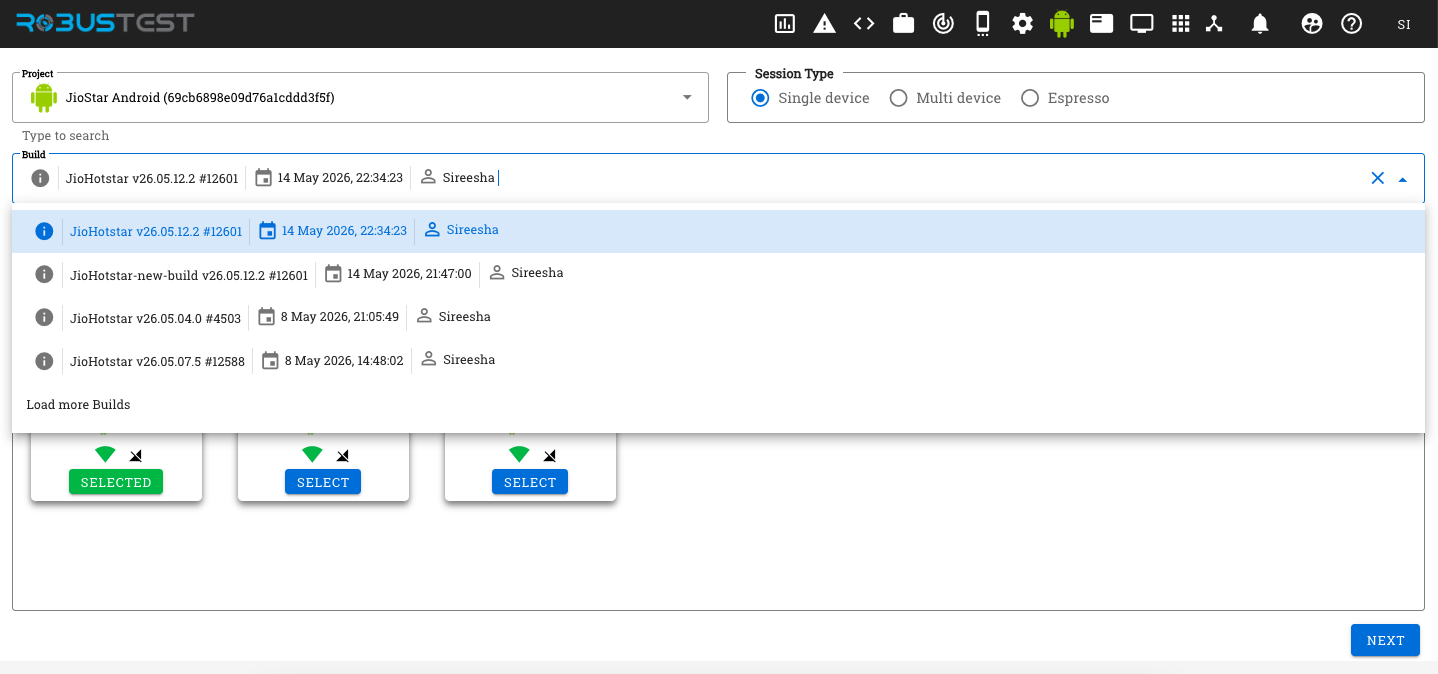
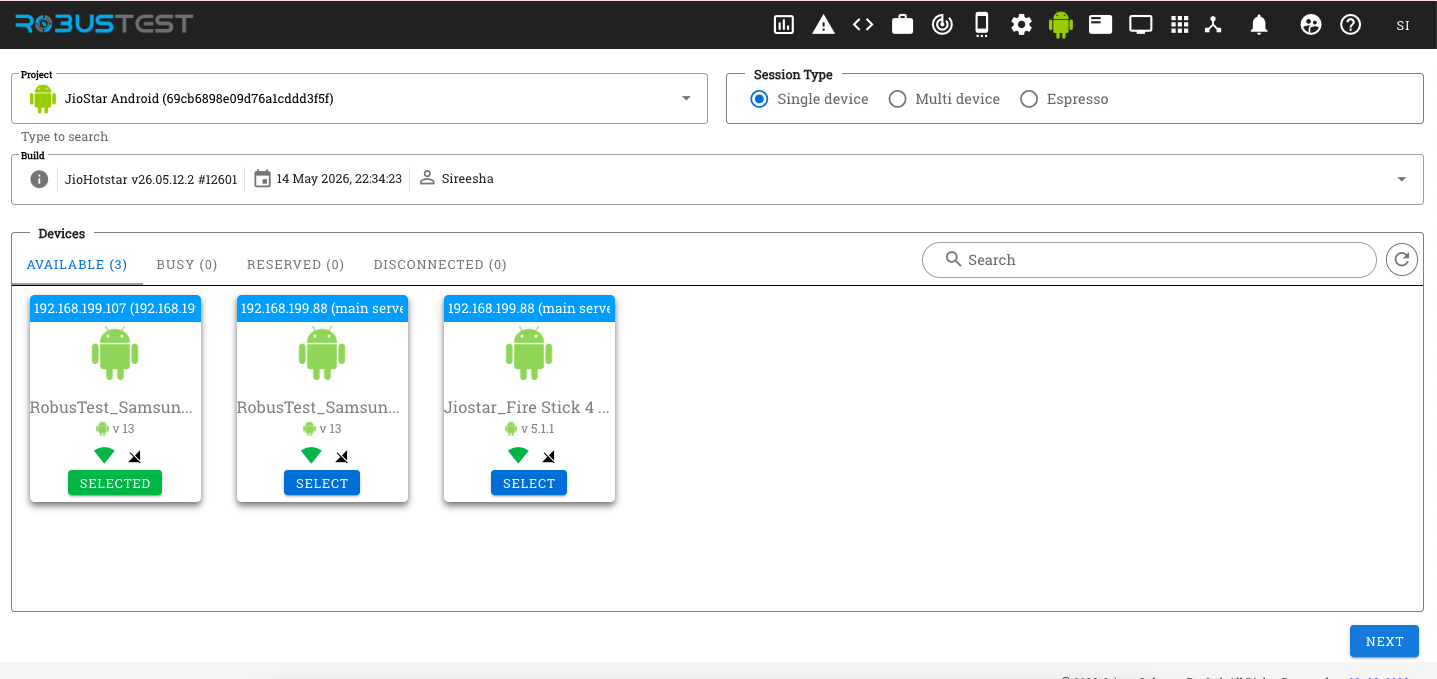
In the Manual Session setup, configure the following:
- Select the build you want to test with.
- Search for and select the device on which you want to start the session.
- Click Next to proceed.
Step 4: Review and Launch
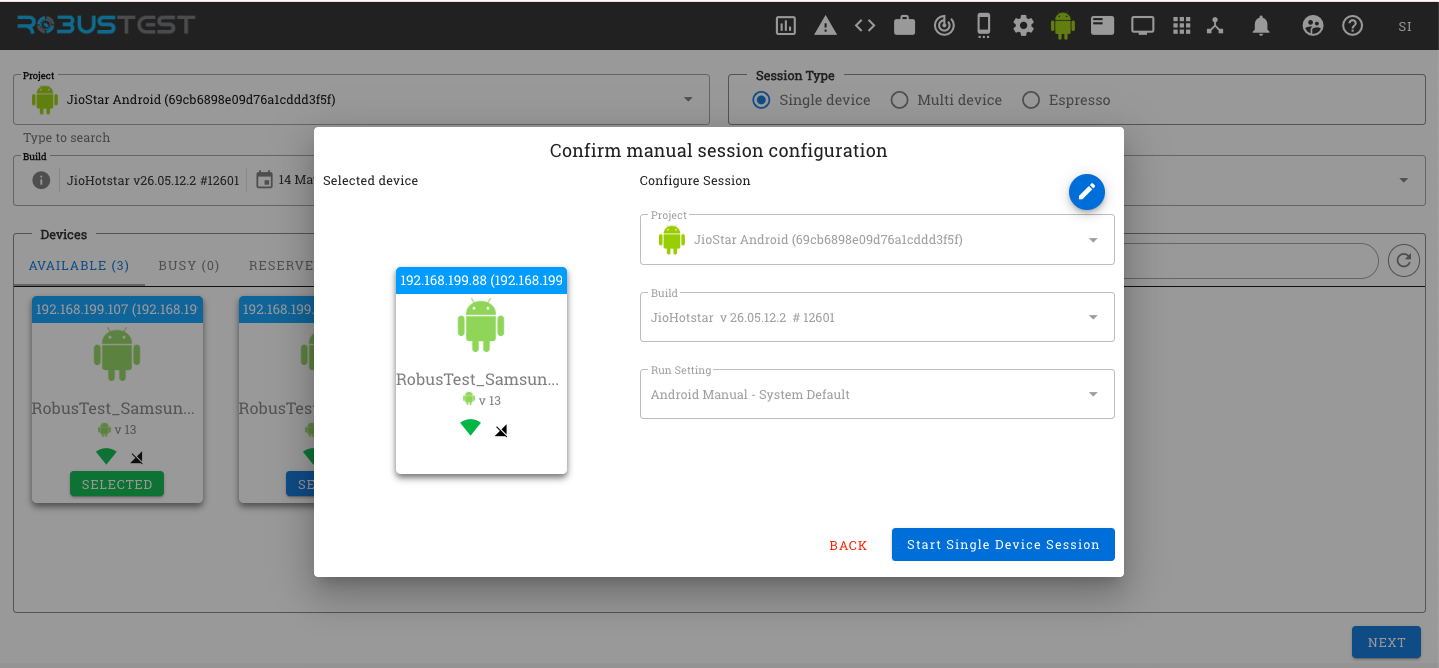
Modify build and run settings on the next screen as needed, then click Start Single Device Session to launch the session.
Step 5: Session Initiating
You will see the manual session initiating. Once connected, the live device screen appears in your browser and is fully interactive — you can begin testing immediately.
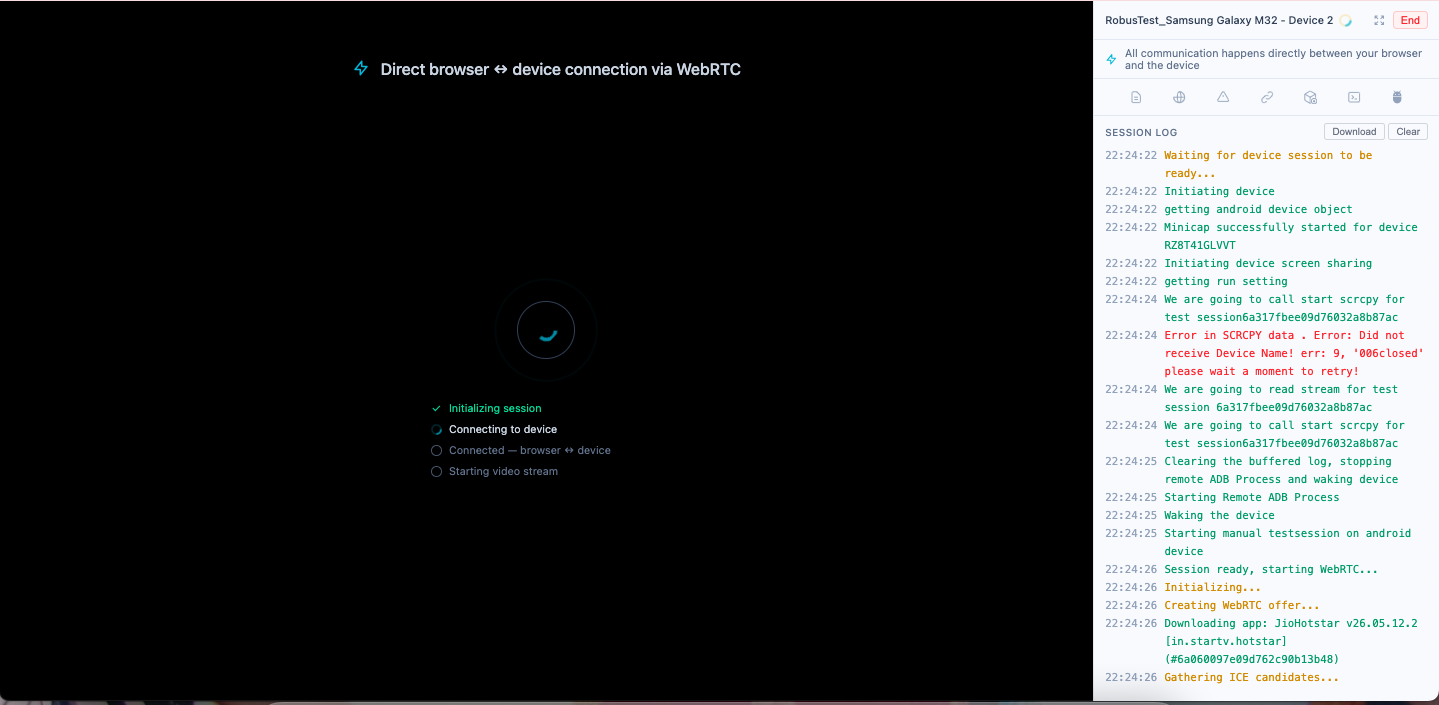
Status messages appear in the Session Log during startup:
| Message | Meaning |
|---|---|
| ICE state: connected | WebRTC peer connection established |
| Connected — waiting for video stream | Connection ready, awaiting video |
| Network recording started | Network traffic capture has begun |
| starting scrcpy server | Initialising screen capture on the device |
| waiting for scrcpy connections | Connecting screen capture to the device |
| scrcpy connected | Screen capture established |
| video streaming active | Live video stream is being sent to your browser |
| audio streaming active | Live audio stream is active |
| Audio track unmuted | Device audio is audible in the browser |
| Screen streaming active | Screen capture fully active |
| Installing app completed | Build successfully installed on the device |
| Starting app | App is being launched |
| Starting app completed | App launched successfully |
Tip: If you see a startup error, wait a few seconds and reconnect. The WebRTC stream is kept alive across reconnection attempts and does not require a full session restart.
Session Interface
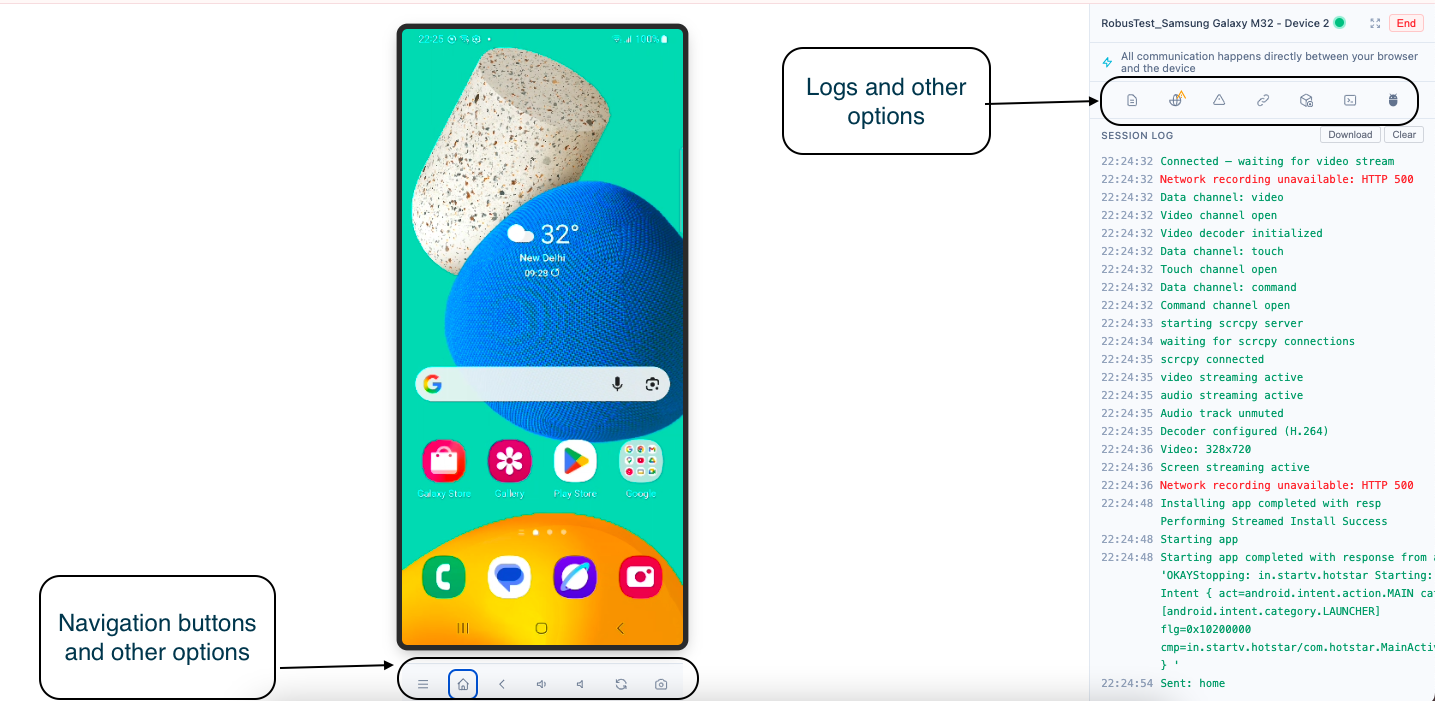
The session interface is divided into two areas:
Device Screen
The primary interaction area. Use your mouse, trackpad, and keyboard to:
- Tap
- Swipe, scroll, and drag
- Enter text via your keyboard directly into the device
The following hardware controls are shown below the device screen:
| Button | Action |
|---|---|
| ≡ Menu | Open recent apps / menu |
| ⌂ Home | Go to home screen |
| ← Back | Navigate back |
| ◁ Volume Down | Decrease device volume |
| ▷ Volume Up | Increase device volume |
| ↺ Rotate | Rotate device orientation |
| 📷 Screenshot | Capture and save screenshot to local Downloads |
Toolbar
The session opens in a new window with the device screen on the left and a Session Panel on the right. The panel contains:
- Device name and status — shown at the top with a green live connection indicator and an End button to close the session
- P2P note — "All communication happens directly between your browser and the device", confirming the WebRTC peer-to-peer connection
- Session tool icons — a row of icons for accessing logs, screenshots, deeplinks, install build, and other tools
- Session Log — displayed directly below the tool icons. A real-time event stream showing WebRTC connection state, audio/video channel status, app install progress, and startup messages. The log can be downloaded or cleared at any time.
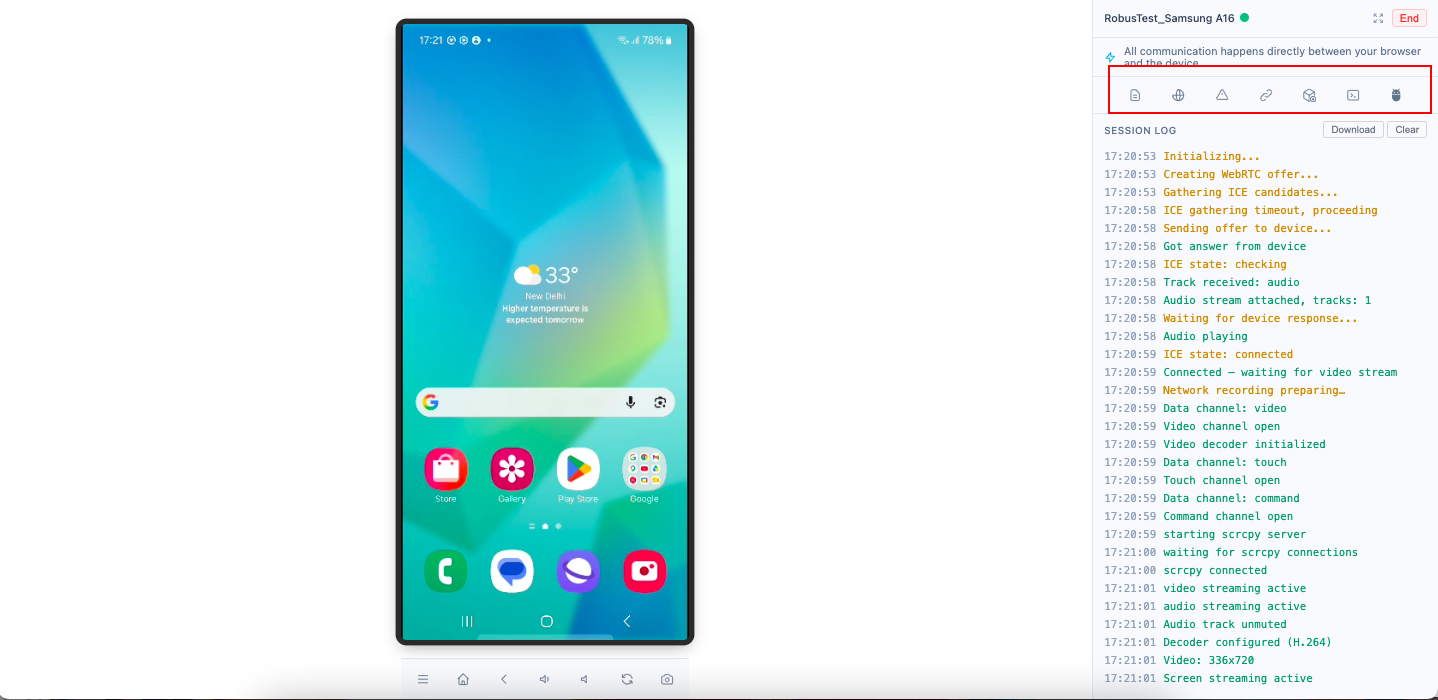
Logs and Other Options
The following features are available in the Logs and other options section of the session panel:
- a. Device logs — View real-time system and application logs streamed from the device.
- b. Network logs — Monitor all network requests made during the session.
- c. ANR logs — Capture Application Not Responding events for crash analysis.
- d. Execute Deeplink — Launch specific app screens or flows directly via deeplink URL.
- e. Install builds — Deploy your application or an updated build onto the connected device without leaving the session.
- f. ADB shell — Run ADB commands directly on the remote device.
- g. Remote ADB — Connect your local ADB client to the remote device for advanced debugging.
- h. Session logs — Access a full log of all activity recorded during the session.
Once testing is complete, end the session to release the device back to the pool. All session data remains available for review.
Android
Device Configuration Controls
Run ADB Commands
Execute ADB commands directly on the device from within the session. Click Run ADB Commands on Device to open the command-line interface.
Run Shell Commands
Execute shell commands on the device without switching tools or terminals.
Copy to Device Clipboard
Copy text from your local machine — such as a mobile number or OTP — directly into the device:
- Copy the text on your local machine (
Ctrl+C/Cmd+C). - Click Copy to Device Clipboard in the toolbar.
- Tap the input field on the device — the text is pasted automatically.
Note: Copy to Device Clipboard is available on Android mobile only.
Audio
Android manual sessions support live audio playback from the device through your browser. This is particularly powerful when combined with proxy — enabling simultaneous audio verification, network log capture, and network proxy rule injection in a single session.
Network Proxy Modifier
When proxy is enabled on the device, open the Network Log tool and click Modifier to intercept and rewrite HTTP/HTTPS traffic in real time, without rebuilding the app.
Common use cases:
- Force specific HTTP status codes on any endpoint (e.g. simulate a 500 on checkout)
- Modify response fields using JSON patch (e.g. set user tier to premium)
- Add, remove, or override request and response headers
- Serve a locally configured response instead of hitting the real server
- Pause a request or response for live inspection before it continues
- Enable or disable individual rules on the fly
Rules are configured as JSON presets. See Network Proxy Advanced Features for the full Rewrite, Map Local, and Network Breakpoints reference with copy-paste examples.
Session Tool Highlights
- ADB Remote Connect — Connect to the device ADB remotely using the command shown in the session. Useful when a developer needs to investigate a bug as if the device were physically connected to their machine.
- Device Log — View device logcat in a filterable table. Download as CSV for offline analysis.
- ANR Log — Download the Application Not Responding log when an app crash occurs.
- Network Log — Capture all HTTP/HTTPS traffic from the device. Load and download the full network log for inspection. Requires proxy to be enabled on the device.
- Session Log — View and download a complete log of all actions and events recorded during the session.
iOS
Note: ADB Commands, Shell Commands, and Navigation Menu Toggle are not available on iOS.
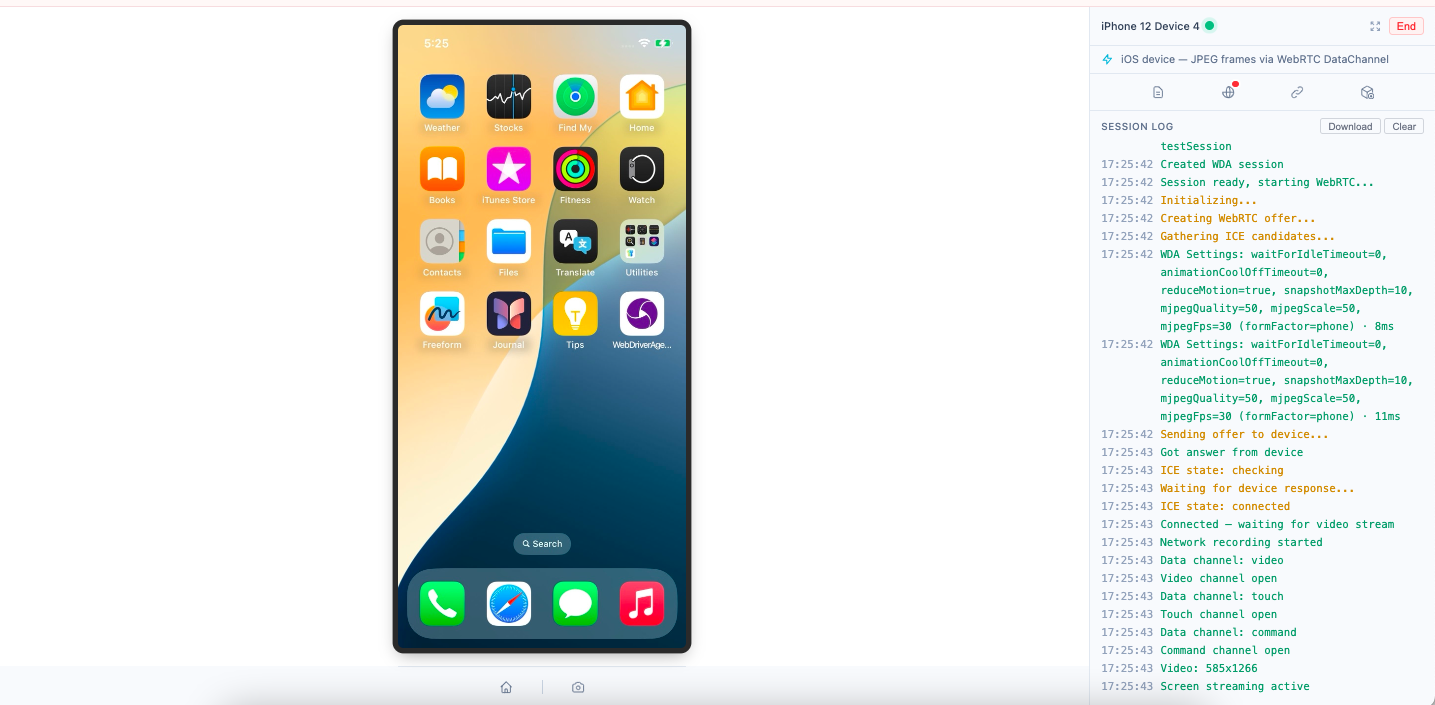
Session Tool Highlights
- Device Log — View and download device logs for the iOS device.
- Network Log — Capture and download HTTP/HTTPS traffic from the device.
- Session Log — View and download a complete log of all session actions and events.
Streaming Behaviour
iOS sessions stream at a fixed 20 fps using native frame capture. Stream quality selection shown for Android is not applicable.
Android TV
Android TV sessions use a dedicated two-node architecture: one node handles screen streaming and another handles keyboard and remote-control input. This is managed automatically by the RobusTest platform; no additional steps are required from the user.
Note: Location Simulation, ADB Commands, and Navigation Menu Toggle are not available in Android TV sessions.
Input Controls
Android TV sessions provide a remote control interface in the session toolbar. Available controls:
- D-Pad — Up, Down, Left, Right navigation
- Select / OK
- Back
- Home
- Menu
- Media controls — Play/Pause, Fast-Forward, Rewind
- Volume — Up, Down, Mute
Use these controls in place of touch gestures, which are not applicable on TV devices.
Streaming Behaviour
Android TV uses WebRTC with a configurable quality profile, identical to Android phones. Select your preferred quality at session start.
Session Tool Highlights
- Device Log — Logcat from the TV device, filterable and downloadable as CSV.
- ANR Log — Download the Application Not Responding log when an app crash occurs.
- Network Log — Capture and download HTTP/HTTPS traffic from the TV device.
- Session Log — View and download a complete log of all session actions and events.
Tizen & webOS
Unlike Android and iOS, Tizen and webOS manual sessions don't mirror the device screen directly. Instead, a camera mounted next to the TV films the physical screen, and that camera feed is streamed to your browser over WebRTC — this lets RobusTest support DRM-protected content that can't be screen-captured natively. Because of this, the session is screen-and-remote only: device logs, ANR logs, and network logs are not available for Tizen or webOS sessions.
Note: Location Simulation, ADB Commands, Copy to Device Clipboard, and the Navigation Menu Toggle are not available for Tizen or webOS sessions.
Aligning the Camera
When a session starts, use the on-screen crop tool to draw a box around the TV's screen in the camera view. This tells RobusTest which region of the camera feed to treat as the live picture.
Input Controls
Both platforms provide a virtual remote in the session toolbar:
- D-Pad — Up, Down, Left, Right navigation
- Select / OK, Back, Home, Exit, Menu
- Volume — Up, Down, Mute
- Channel — Up, Down
- Colour buttons and number pad
- Power — wakes the TV via Wake-on-LAN
Your keyboard can also be used as a remote while the session window is focused.
webOS additionally supports pointer/cursor control, emulating LG's Magic Remote: moving your mouse over the video moves the on-screen pointer, clicking sends a select, and scrolling with the mouse wheel scrolls on the TV. This pointer mode is not available on Tizen, which is D-pad only.
Known limitation: On Samsung Tizen, the Exit button and volume/mute controls frequently don't respond — this depends on the app and on whether the TV's audio is routed through an optical/external output. This is a platform limitation, not a connection issue.
Session Tool Highlights
- Device Screenshot — Captures the current camera frame (i.e., what's visible in your cropped view), not a native OS screenshot.
- Session Log — View and download a complete log of all session actions and events.
Logs
Log tools are accessible from the session panel on Android, iOS, and Android TV. Logs can be viewed inline and downloaded for offline analysis.
Note: Tizen and webOS sessions don't provide any of the log tools below — see Tizen & webOS.
Device Log
A real-time stream of system-level messages from the device (logcat on Android, system log on iOS). Use it to:
- Identify crashes, exceptions, and stack traces
- Monitor app lifecycle events (launch, pause, resume, stop)
- Debug issues that don't surface in the app UI
Logs are displayed in a filterable table. Download as CSV for sharing or further analysis.
Note: Not available on Tizen or webOS.
API
GET /v3/testsession/:id/devicelog
ANR Log
Captures the Application Not Responding (ANR) report generated when an app freezes and the OS kills it. The ANR log is available to download after an ANR event occurs during the session. Use it to:
- Identify the thread and call stack responsible for the freeze
- Determine whether the main thread was blocked by I/O, a lock, or a long operation
Note: ANR Log is available on Android and Android TV only (not available on iOS, Tizen, or webOS).
Network Log
Records all HTTP/HTTPS traffic between the device and external services during the session. Captured as a HAR file. Use it to:
- Inspect API requests and responses
- Verify correct headers, payloads, and status codes
- Debug network errors or unexpected responses
- Use alongside the Network Proxy Modifier to verify rule effects (Android only)
Note: Proxy must be enabled on the device for network capture to work. Not available on Tizen or webOS.
API — View traffic:
GET /network/testsession/:id
API — Download as HAR:
GET /v3/testsession/:id/network/har
Session Log
A timestamped event log covering the full lifecycle of the session — from WebRTC connection setup through app install, launch, and teardown. Visible in the right-side session panel throughout the session. Use it to:
- Confirm the session connected and the app launched successfully
- Diagnose startup failures (e.g. install errors, stream not starting)
- Share a record of session events with your team
The log can be downloaded or cleared from the session panel at any time.
API — All session logs:
GET /v3/testsession/:id/logs
Common Session Tools
The following tools are available across all platforms.
Device Screenshot
Capture the current device screen at any point. Screenshots are saved to your local Downloads folder.
Execute Deeplink
Test app deeplinks from within the session:
- Enter the deeplink URL.
- Optionally provide a package name.
- Click Execute.
Install Build
Install a different build mid-session. Search by Build ID or select from builds previously uploaded to the project.
Pausing and Resuming a Session
You can pause an active session without releasing the device. This is useful when you need to step away briefly but want to preserve your session state.
- Pause — Click the Pause button in the session header. The device remains reserved and the session stays open.
- Resume — Click Resume to continue where you left off.
Note: An idle session may be terminated automatically if it exceeds the idle timeout configured in Admin Console → Settings → Test Session.
Ending a Session
Click End Session to exit and release the device.
Important: Ensure you have saved all necessary screenshots, logs, and notes before ending the session.
Related Documentation
- WebRTC Session — WebRTC streaming details and quality profiles
- Multi-Device Testing — Parallel testing across multiple devices
- Live View — Monitor and manage all active sessions in real-time
- Run Settings — Session and run configuration parameters
- Live View — Monitor and manage all active sessions