
Performance Benchmarks
A performance benchmark is a set of App Vitals values that you decide a good build should stay within. After every job that has App Vitals turned on, RobusTest compares the new build with the benchmark and gives the job a clear result: Pass, Fail, or Not compared.
Use it to catch performance regressions — more memory, more CPU, slower start, more janky frames, crashes — before a build ships, without reading every App Vitals report by hand.
In short: you create a benchmark once from good runs → every new job with App Vitals is compared with it → the result shows on the job report and in the jobs list.
Before you start
| You need | Details |
|---|---|
| An Android App or iOS App project | Benchmarks are not available in web or Universal projects. A benchmark gets its platform from its project: a benchmark in an Android App project is for Android only, and one in an iOS App project is for iOS only. You can't use iOS runs in an Android benchmark (or the other way round), and a job is only compared with a benchmark of its own platform. |
| App Vitals turned on | In the job's Run Setting, open the Performance section and switch on App Vitals. See App Vitals. Jobs without App Vitals are not compared. For the Cold start metric on Android, also turn on App Vitals cold start (see below). |
| At least one job with App Vitals data | Optional but recommended: a benchmark is easiest to build from real runs of a build you trust. You can also type the values in by hand. |
| Project admin role | Only project admins can create, edit, set the default or delete (through the API) a benchmark. Other project members can open and read benchmarks, but cannot create or change them. |
How it works
- Create a benchmark for the project. For each test case, set the value each metric should be compared with (for example, "memory used: 180 MB").
- Add checks. A check says how much worse than the benchmark a build may be before it fails (for example, "fail if memory is more than 10 % higher").
- Set it as the project default. Creating a benchmark is not enough on its own: jobs are compared with the project's default benchmark, so mark yours as the default. (Optional: to use a different benchmark for one job, add its ID to the Run Setting, see below.)
- Run a job with App Vitals on. When the job finishes, RobusTest compares each test case with the benchmark.
- Read the result on the job report, in the jobs list, or on the Job performance page.
A job is compared with the project's default benchmark. If the job's Run Setting also names a benchmark, the one in the Run Setting is used instead.
Important — set a default benchmark. Creating a benchmark does not make it the default by itself. If the project has no default benchmark and the job's Run Setting doesn't name one, no comparison happens: the job shows Not compared ("no benchmark"). Tick Make this the project default when you create the benchmark, or click Set as default on it later.
Opening the benchmarks
On the Project Dashboard of an Android App or iOS App project, click Performance benchmarks (next to Traffic Modifier). This opens the benchmark list for the project.

The benchmark list
The list shows every benchmark in the project.
| Column | Meaning |
|---|---|
| Name | The benchmark name. The one marked Default is used by jobs that don't name another. |
| Platform | Android or iOS (taken from the project). |
| Version | The current version, for example v3. |
| Source | Where the values came from (runs you picked, or typed values). |
| Runs / Checks | How many runs the values are based on, and how many checks are set. |
| Last changed / Created by | When it was last saved, and by whom. |
Admins can Create benchmark (button at the top), open a benchmark to Edit it, or click Set as default. (There is no delete button on these pages — see the note below.) If the project has none yet, the page says No benchmarks yet and job results show Not compared until one exists.
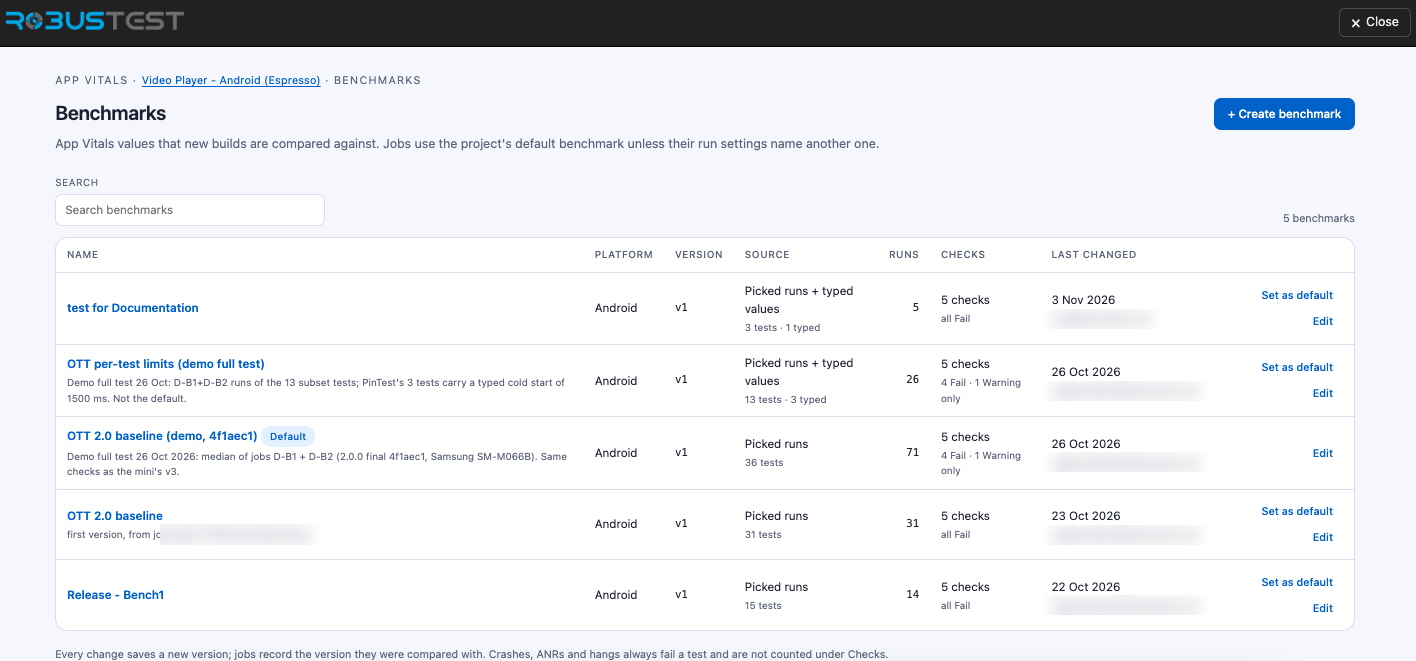
The line at the bottom of the page is a reminder: Every change saves a new version; jobs record the version they were compared with. Crashes, ANRs and hangs always fail a test and are not counted under Checks. The count at the top right (5 benchmarks) shows how many the project has, and Search benchmarks filters the list by name.
The Checks column summarises each benchmark's checks, for example 5 checks · all Fail. Benchmarks saved earlier may also show Warning only checks; new benchmarks only have Fail checks.
Creating a benchmark
Click + Create benchmark. The page has three tabs — Details, Test cases and benchmark values, and Checks. A red number on a tab shows how many things are still missing there. The Create benchmark button stays disabled until everything is filled in, and the first missing item is shown in red next to it (for example, Name the benchmark to save, Add at least one test case to save, Add at least one check to save). Cancel leaves without saving.
Tab 1 — Details
| Field | Description |
|---|---|
| Name | A short name, for example Release 5.2 baseline. |
| Description (optional) | What the benchmark is for. |
| Make this the project default | When ticked, every job in the project that has App Vitals on (and doesn't name another benchmark) is compared with this one. It replaces the current default. Hover the i icon next to it for a reminder. |
| Platform | Shown for information, for example Android · from the project. You can't change it. |
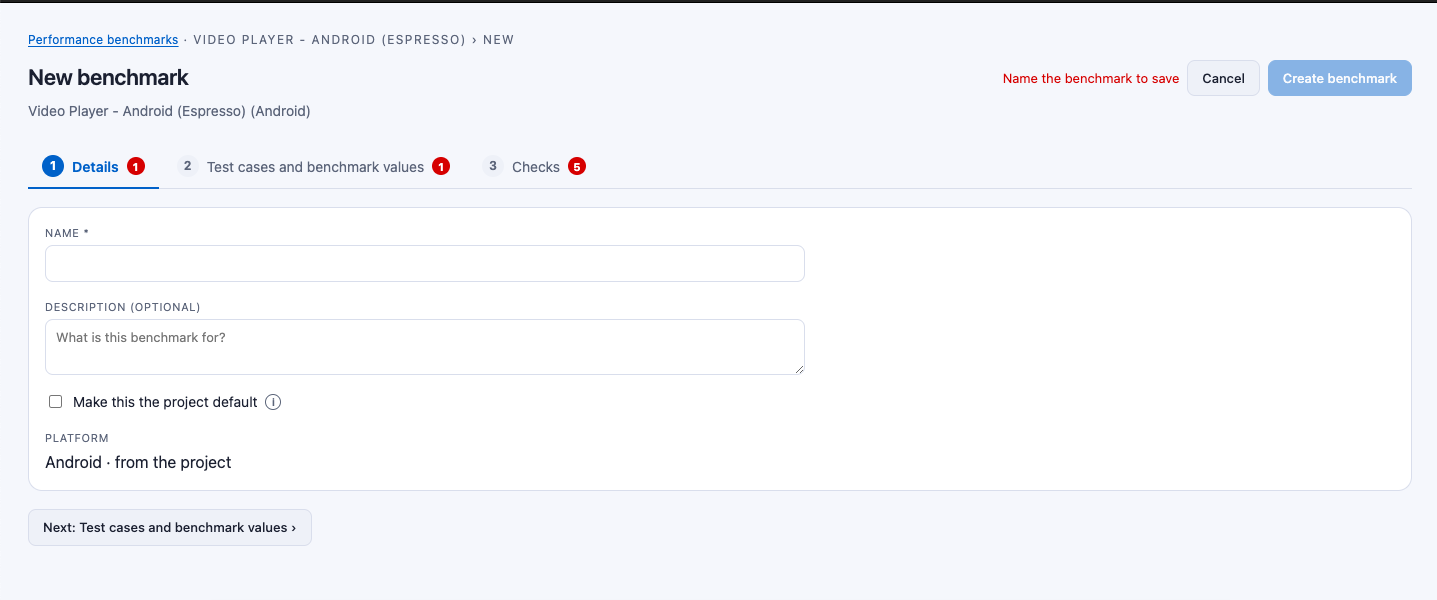
When you are done, click Next: Test cases and benchmark values at the bottom of the page.
Tab 2 — Test cases and benchmark values
This tab holds the test cases the benchmark covers and the value each metric is compared with. Until you add one, it says No test cases yet. The top of the tab shows + Add test cases, Calculate values from a job… (available once at least one test case is added), and a count such as 0 test cases on the right.
Adding test cases
Click + Add test cases. A pop-up lists every test case in the project.
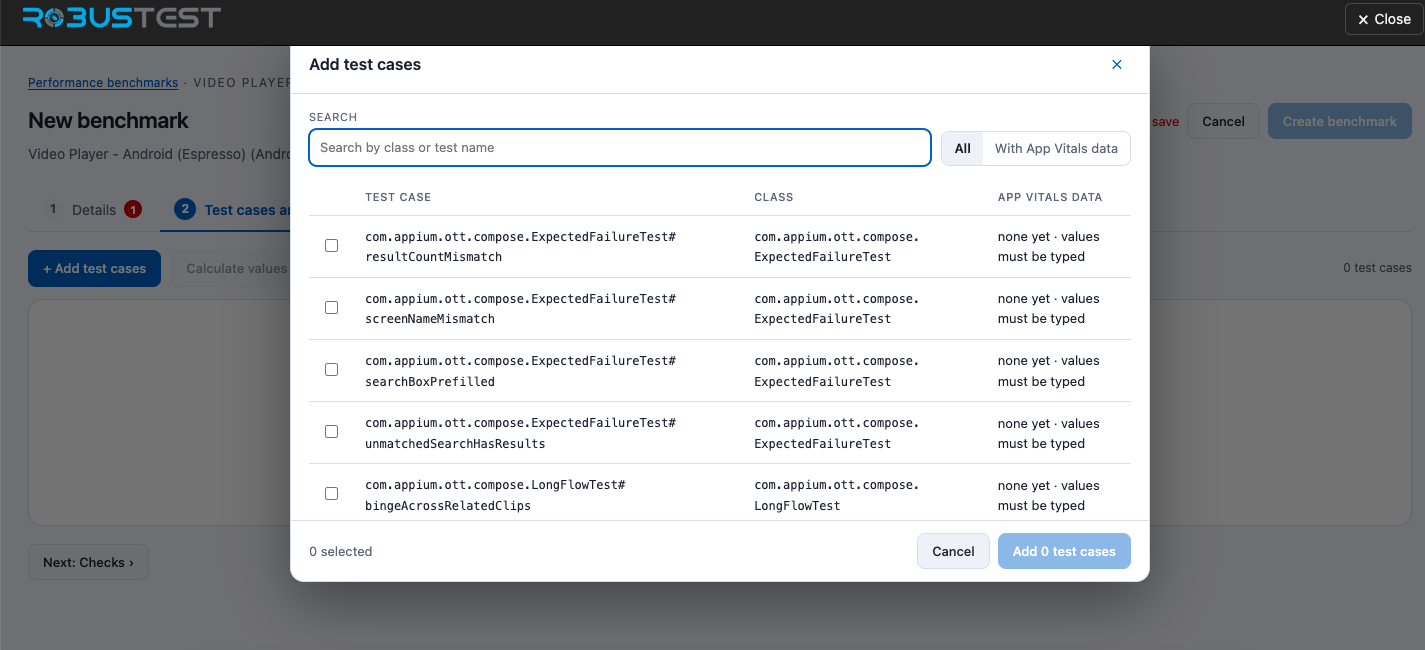
| Option | What it does |
|---|---|
| Search | Type part of a class name or test name to narrow the list. The list updates as you type. If nothing matches, the pop-up says No test cases match. |
| All / With App Vitals data | All lists every test case. With App Vitals data shows only the test cases that have been run with App Vitals on. |
| Checkbox | Tick each test case you want. A test case already in the benchmark is greyed out and marked already in this benchmark. |
| App Vitals data column | Shows how many attempts have App Vitals data and when the last one ran. none yet · values must be typed means there is nothing to calculate from, so you must type the values. |
| … selected / Add N test cases | The footer shows how many you ticked. Click Add N test cases to add them, or Cancel to close without adding. |
Test cases are matched by class and test name (on iOS, also the test plan configuration). If you rename a test, it counts as a new test and will not be compared until you add it.
Setting the values
Each test case becomes a row with one column per metric. Set each value in one of three ways:
| Way | When to use it |
|---|---|
| Typed | You know the number you want (for example, a cold start target of 1,500 ms). Type it in the box. |
| Calculated | Take the value from real runs. The value is the median of the runs you use. Janky frames are calculated from all frames of the runs added together. |
| Empty | Leave it blank. That metric is not compared for that test case (unless its check is a fixed limit — see Checks). |
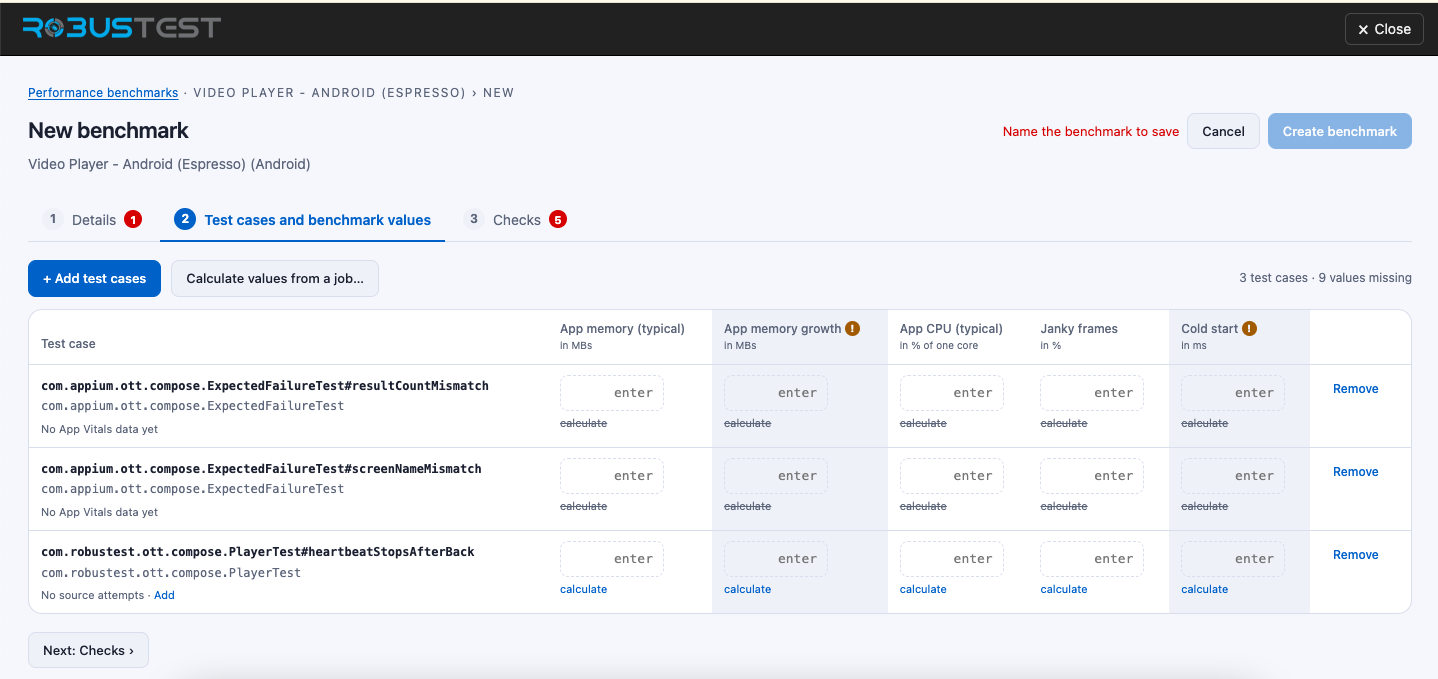
Calculate works only for test cases that have been run with App Vitals on. In the screenshot above:
- The first two test cases say No App Vitals data yet. Their calculate links are greyed out and struck through, so you can't calculate from runs. Type the values instead (or run the test with App Vitals on, then come back).
- The third test case has App Vitals data, so its calculate links are active (blue). It says No source attempts · Add because you haven't yet chosen which runs to use. Click calculate under any value, or Add, to open Attempts for … and pick the runs. Once you pick runs, every empty value of that test case is filled from them.
Calculated values, and changing them by typing
Once you pick the runs for a test case, the values are calculated for you — you don't have to work them out. Each value is the median of the runs you chose.
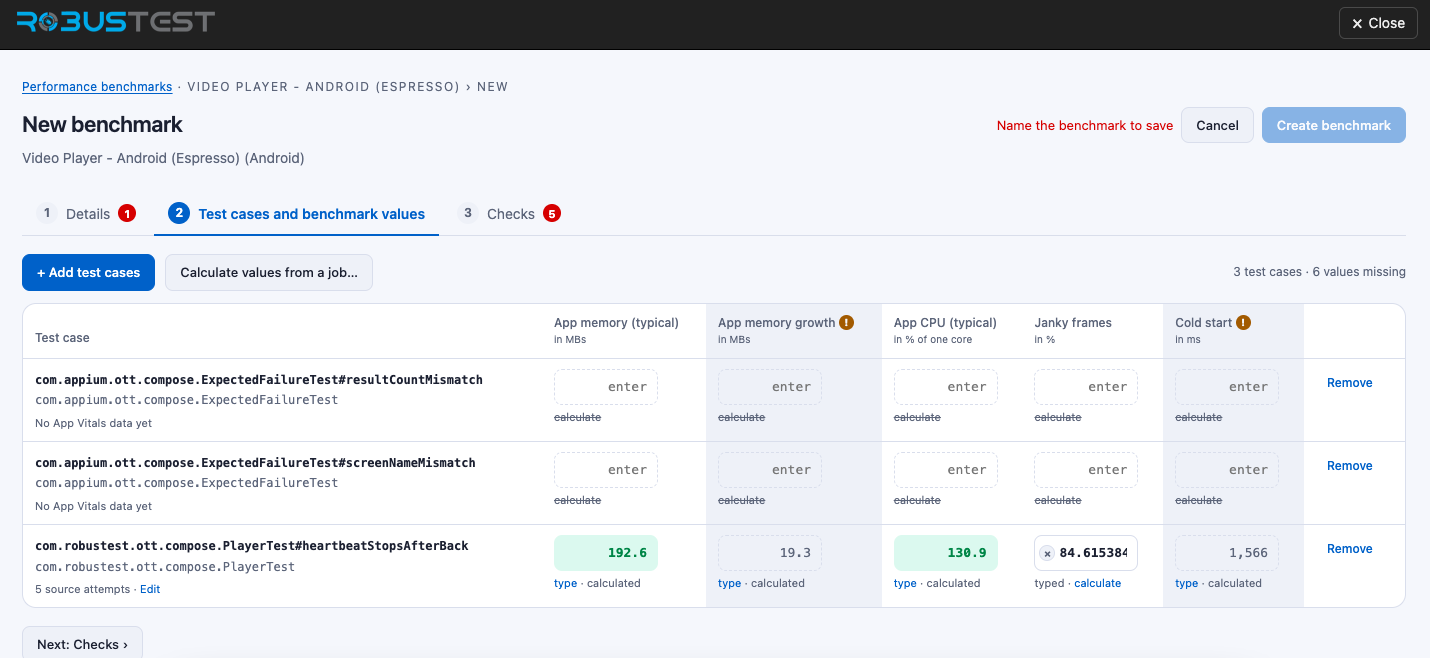
In the screenshot, the third test case now says 5 source attempts · Edit, and four of its values are filled in. Under each value a small label shows where it came from:
| Label under the value | Meaning |
|---|---|
| type · calculated | The value was calculated from the source attempts. It is shown as a read-only number. Click type if you want to change it. |
| typed · calculate | The value was typed by you. Click calculate to go back to the value calculated from the runs. |
| Edit (next to N source attempts) | Opens Attempts for … again so you can change which runs are used. Calculated values update when you click Use N attempts. |
To change a calculated value: click type under it. The number becomes a box you can edit, and it keeps the calculated number as a starting point. Type the value you want, for example a stricter target. The label changes to typed, as with Janky frames in the screenshot. Use this when you know the number a build must meet, or when a calculated value looks too low or too high.
To undo: click calculate under a typed value to use the calculated value again, or click the × in the box to clear it.
A typed value is kept when you later change the source attempts or use Calculate values from a job… — only calculated values are refreshed.
Other options on each row:
| Option | What it does |
|---|---|
| Attempts (under the test case name) | Opens Attempts for …, where you choose which runs the calculated values come from. If the test case has no source attempts yet, it shows No source attempts · Add. |
| calculate / type (under each value) | Switch that one value between calculated and typed. A calculated value switched to type keeps its number so you can adjust it. calculate is greyed out when the test case has no App Vitals data. |
| × (in a value box) | Clears the value, so the metric is not compared. |
| Remove (end of the row) | Takes the test case out of the benchmark. |
| ! (in a column heading) | The metric has no check yet (its values are kept but not compared), or its check is a fixed limit (the benchmark value is ignored). |
Choosing the runs: Attempts for …
What it is for. A calculated benchmark value comes from real runs of the test case. Attempts for … is where you choose which runs. Every time a test case ran with App Vitals on (in any job of the project) is one attempt. Tick the attempts that represent a healthy build; RobusTest takes the median of them as the benchmark value. Choosing runs by hand lets you leave out a run you don't trust, for example one from a different device or a different build.
To open it, click Add under a test case that says No source attempts, click Attempts, or click calculate under a value.
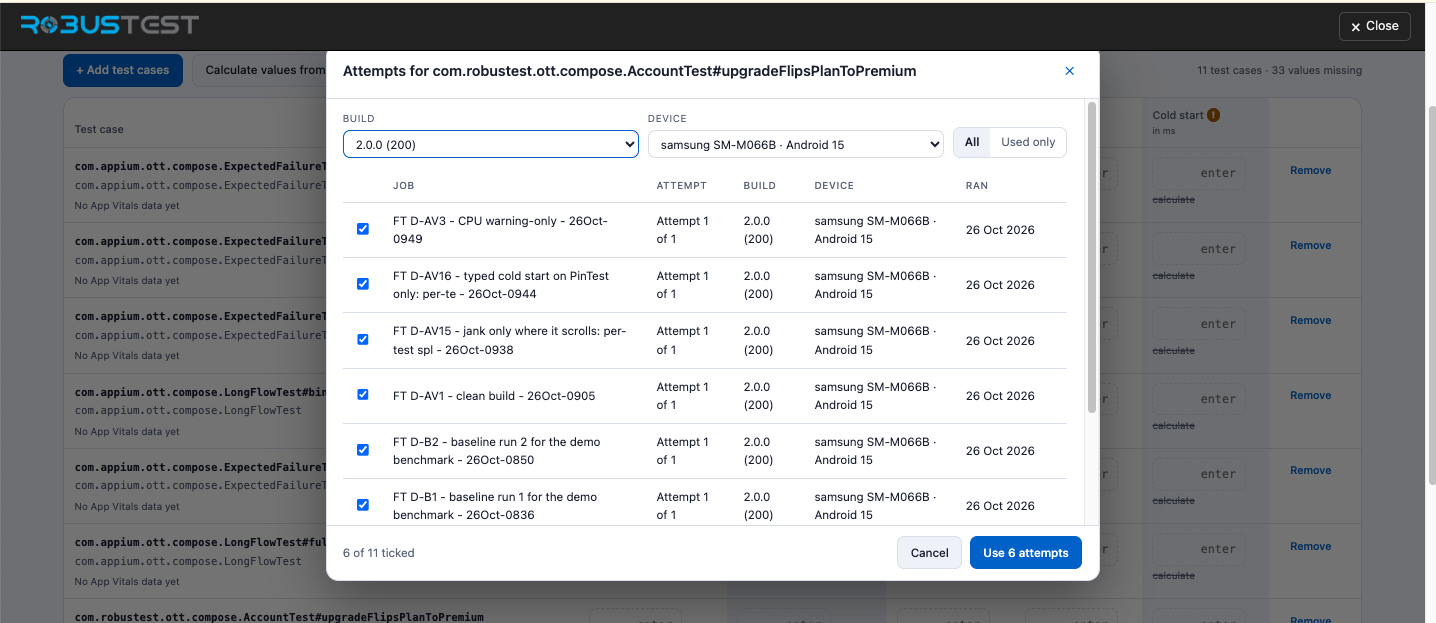
| Part of the pop-up | What it does |
|---|---|
| Build | Shows only attempts of one app build. Builds are listed by version name and code, for example 2.0.0 (200). Choose All to see every build. |
| Device | Shows only attempts from one device and OS, for example samsung SM-M066B · Android 15. Comparing like with like gives a steadier value, so keep one build and one device when you can. |
| All / Used only | All lists every attempt that matches the filters. Used only lists just the attempts you have ticked. |
| Table | For each attempt: the job it ran in, the attempt number (for example Attempt 1 of 1; a retried test has more), the build, the device and the date. Tick the box to use it. |
| unusual: … tag | The test did not complete or pass, or the collector had a problem. These attempts are not ticked for you. |
| N of M ticked | How many attempts you are using out of all that are listed. |
| Use N attempts | Saves your choice and fills the test case's values from those attempts. Cancel closes without changing anything. |
When you open the pop-up for a test case that has no source attempts yet, RobusTest ticks the usual attempts that match the first build and device for you. Review the ticks and change them if needed.
Below the table, the pop-up previews the value each metric would get from the ticked attempts, with the lowest–highest range. If you have ticked fewer than 3 attempts it reminds you that 3 or more give a steadier value. A value you typed yourself is kept — it is not replaced.
Two ways to calculate values
You can calculate values from real runs in two ways. Use whichever suits you — you can mix them:
- From specific attempts, one test case at a time. Open Attempts on a test case and tick the runs you trust. Best when you want to choose runs by hand (for example, leave out a run on a different device).
- From one job, for many test cases at once. Click Calculate values from a job… at the top of the tab. Best when one job is your "good build" and you want to fill every test case from it in one go.
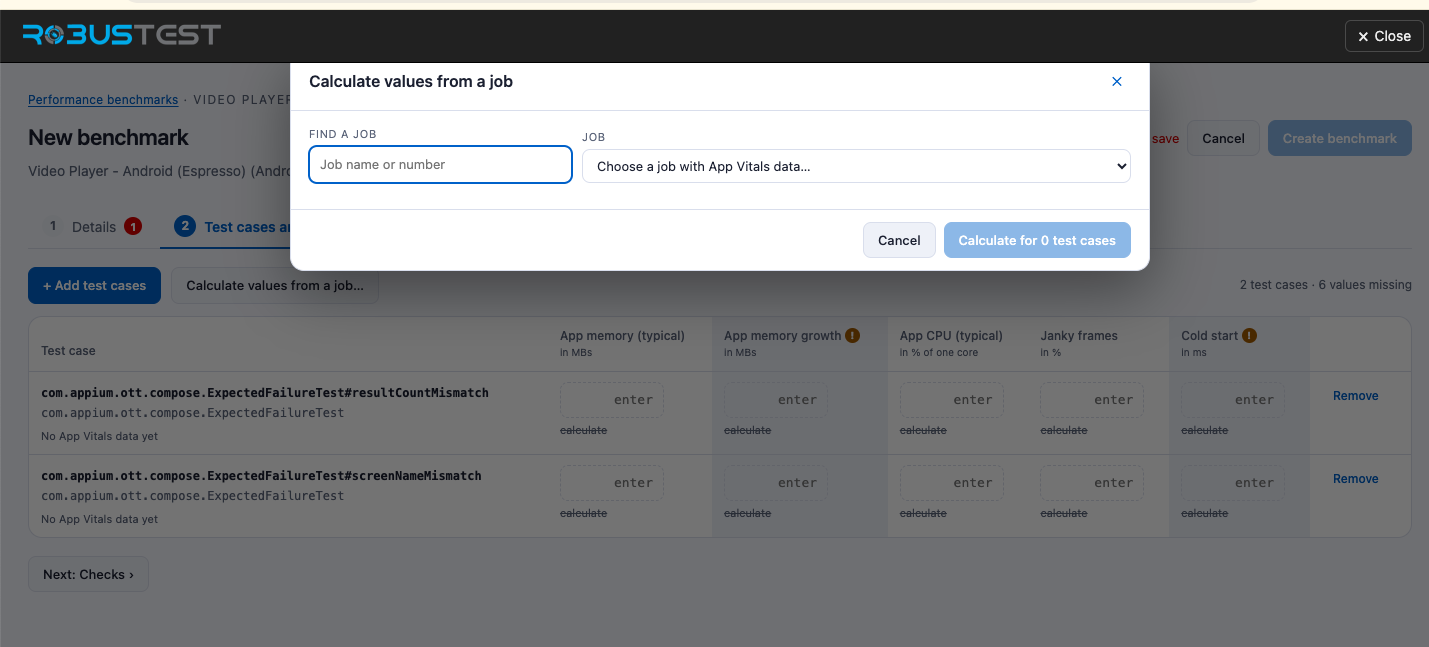
In the pop-up, type a job name or number in Find a job to narrow the list, then choose the job in Job (only jobs with App Vitals data are listed, each with its date and number of attempts). The pop-up then lists each test case in the benchmark with what will happen — values calculated from N attempts, Not in this job · unchanged, or Every attempt is unusual · unchanged. Values you typed are kept. Only test cases already in the benchmark are filled; use + Add test cases to add more. Click Calculate for N test cases to apply.
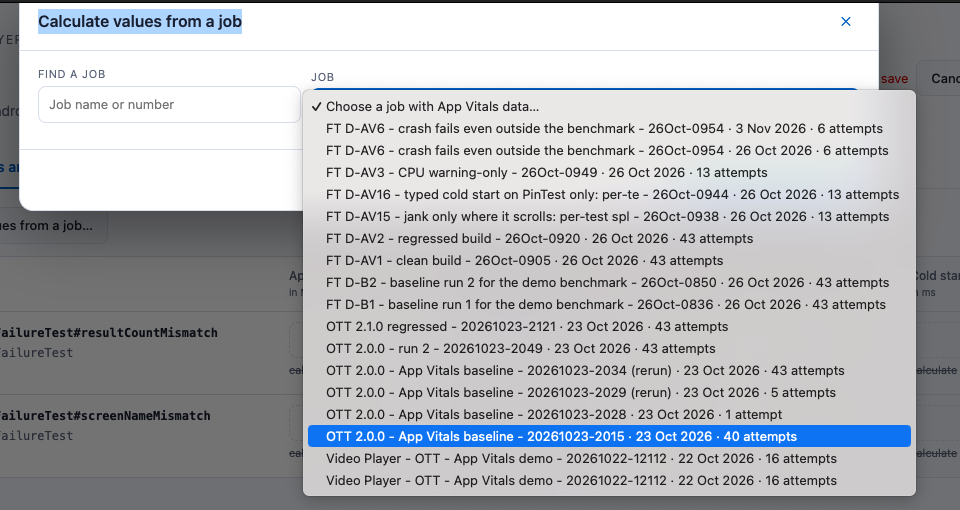
The Job drop-down lists only jobs of this project that have App Vitals data. Each entry shows the job name, its number, the date it ran, and how many attempts have App Vitals data (for example, … · 23 Oct 2026 · 40 attempts), newest first. Pick the job that ran the build you want as your benchmark. If you can't find it, type part of its name or number in Find a job. If no job has App Vitals data yet, the pop-up says so — run a job with App Vitals on first.
When you are done, click Next: Checks.
The tab also shows how many test cases you have and how many values are still missing (for example, 2 test cases · 6 values missing).
Which metrics appear
The table has one column for each metric that has a check (see Checks). A new benchmark starts with five checks, so you see these five columns:
| Column | Unit |
|---|---|
| App memory (typical) | MB |
| App memory growth | MB |
| App CPU (typical) | % of one core |
| Janky frames | % |
| Cold start | ms |
Add a check for another metric on the Checks tab and its column appears here. All the metrics a benchmark can hold:
| Metric | Unit | Android | iOS |
|---|---|---|---|
| App memory (typical) — median | MB | ✅ | ✅ |
| App memory (95th percentile) | MB | ✅ | ✅ |
| App memory growth | MB | ✅ | ✅ |
| App CPU (typical) — median | % of one core | ✅ | ✅ |
| Threads growth | threads | ✅ | ✅ |
| Janky frames | % | ✅ | — |
| Cold start | ms | ✅ | — |
Janky frames and cold start are not captured on iOS yet, so iOS benchmarks do not offer them. Values can't be negative, and a value in % can't be over 100.
When you pick runs, RobusTest shows warnings so you can judge how reliable the values are:
- Few runs — the value is based on fewer than 3 runs.
- Runs differ — the picked runs were made on different phone models, RAM, chipsets, OS versions or builds.
- Low coverage — App Vitals could only read the app's CPU and memory for less than 80 % of the test.
- Unusual run — the test did not complete or pass, or the collector had a problem. Such runs are tagged unusual and are not ticked for you; tick one only if you are sure you want it.
Tab 3 — Checks
Values say what a good build looks like. Checks say how much worse a new build may be before it fails. They apply to every test case in the benchmark, and each metric can have one check.
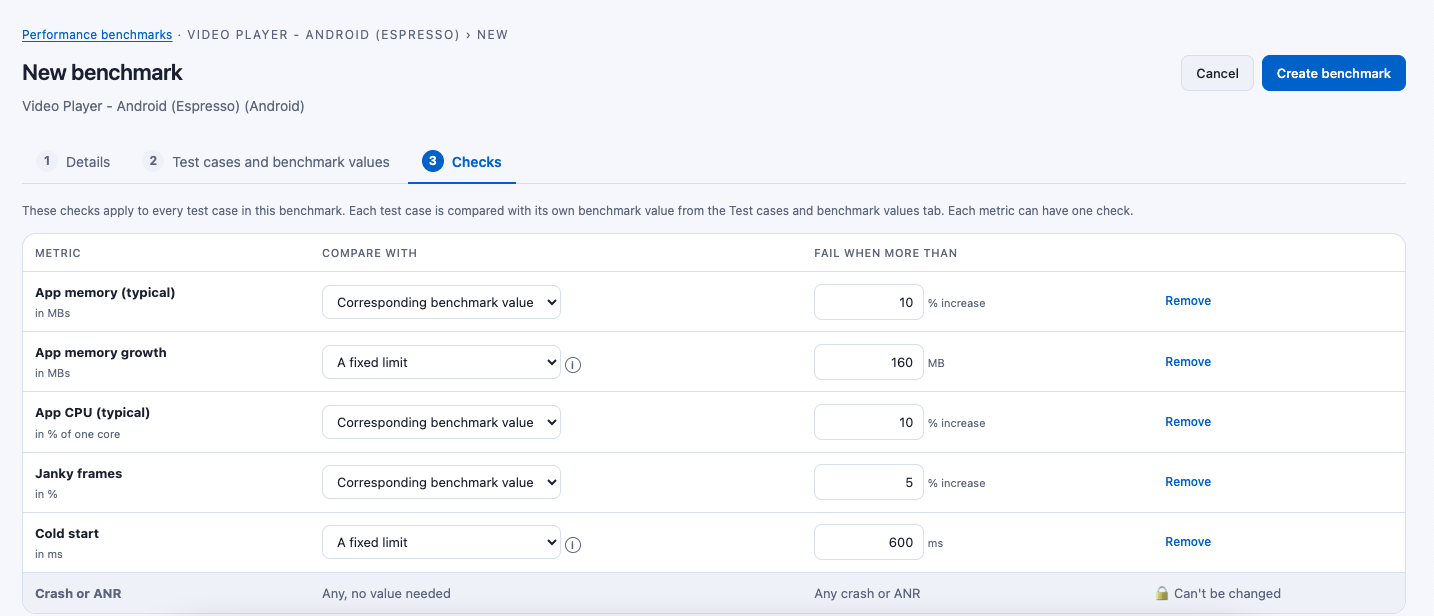
A new benchmark starts with one row for each of the five usual metrics, with the limit left empty. You type every limit — RobusTest never fills one in for you. The red number on the Checks tab counts the limits still missing. A benchmark needs at least one check, and every check needs a limit. When all are filled in, Create benchmark becomes active (compare the earlier screenshot, where it was greyed out).
| Column | Description |
|---|---|
| Metric | The metric being checked, with its unit underneath (for example App memory (typical) in MBs). |
| Compare with | Choose how the limit works — see below. |
| Fail when more than | The limit. For Corresponding benchmark value it is a percentage and reads N % increase. For A fixed limit it is a number in the metric's unit (MB, ms, …). |
| Remove | Deletes the check. That metric is then not compared. |
Compare with has two options:
| Option | What it means | Example |
|---|---|---|
| Corresponding benchmark value | Each test case is compared with its own benchmark value from the previous tab. The limit is how many percent higher the new build may be. | App memory (typical) · 10 % — fail if the median memory is more than 10 % above the test case's benchmark value. |
| A fixed limit | The new build is compared with one number, whatever the benchmark value is. An ⓘ icon next to it reminds you that benchmark values are ignored for this check. | Cold start · 600 ms — fail if the cold start is slower than 600 ms. |
Good to know:
- Percentage checks need a benchmark value. If a test case's value is empty (or 0), that metric is not compared for it. A fixed limit works even when the benchmark value is empty.
- Add more checks. Below the table, + Add check lists the metrics that don't have a check yet (for example App memory (95th percentile) or Threads growth), with a line metrics without a check: …. Pick one to add a row. Its column then appears on the Test cases and benchmark values tab.
- Crash or ANR is always checked. The grey, locked last row (Any, no value needed — Any crash or ANR — Can't be changed) means any crash or ANR fails the test, no matter what else you set. On iOS it reads Crash or hang.
- Checks only fail. There is no "warning only" level for new benchmarks.
- On the values tab, a ! next to a metric name means it has no check yet (its values are kept but not compared) or its check is a fixed limit (its benchmark values are ignored).
Click Create benchmark to save it as version 1.
Opening a saved benchmark
Click a benchmark's name in the list to open it. This page shows everything the benchmark holds, so you can check it before relying on it.
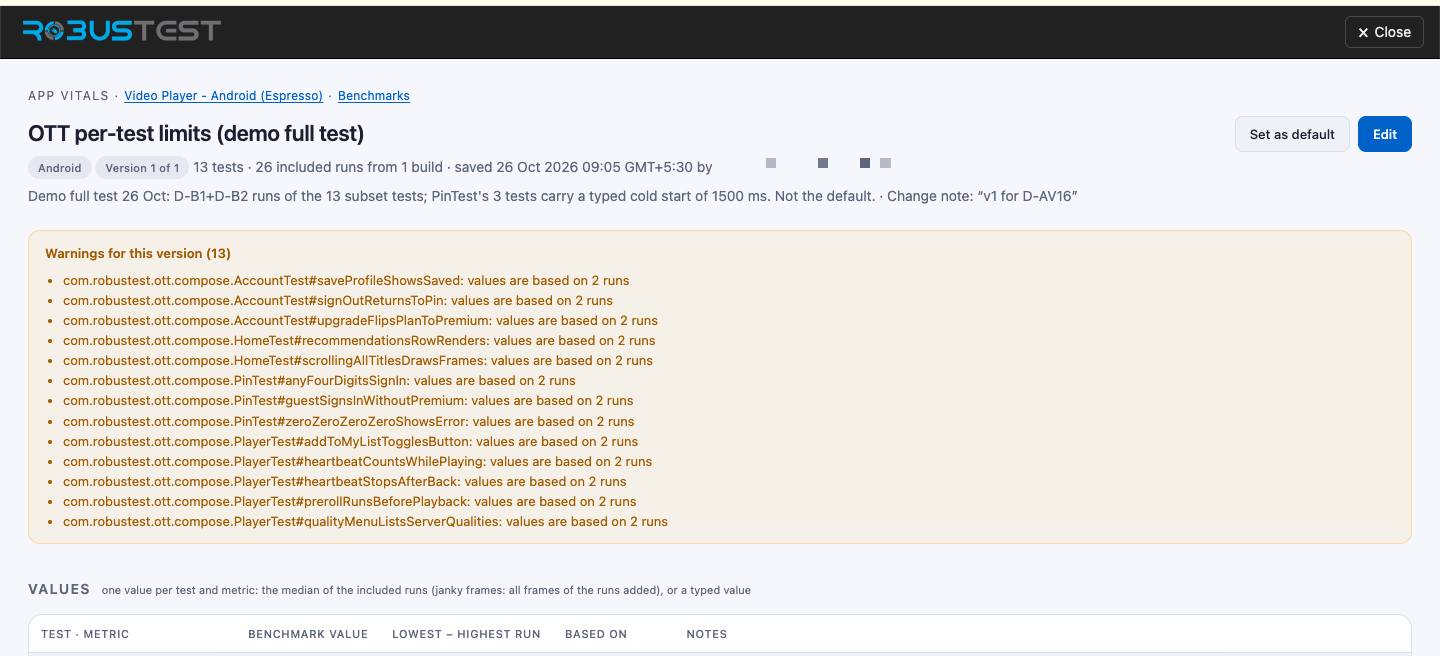
| Part of the page | What it shows |
|---|---|
| Name, platform and version | The benchmark name, Android or iOS, and which version you are looking at (for example Version 1 of 1). |
| Summary line | How many tests it covers, how many runs its values come from and from how many builds, and when and by whom it was saved. |
| Description and change note | The description you wrote, and the note saved with this version (Change note: …). |
| Set as default / Edit | For project admins. Others can read the page but not change it. |
| Warnings for this version | Reasons to treat some values with care — for example values are based on 2 runs (fewer than 3), runs from different devices or builds, or low coverage. They are the same warnings shown when you built the benchmark, and they also appear on job results. |
| Values | One row per test and metric: the Benchmark value, the Lowest – highest run it was calculated from, how many runs it is Based on, and any notes. A typed value is marked as typed. Show runs opens the runs behind a value and whether each was Included or Left out. |
| Checks in this version | The checks that apply to every test: the metric, Compare with, Fail when more than, and the locked crash / ANR row. |
| Version history | Every version with who saved it, when, and the change note. |
The Values table
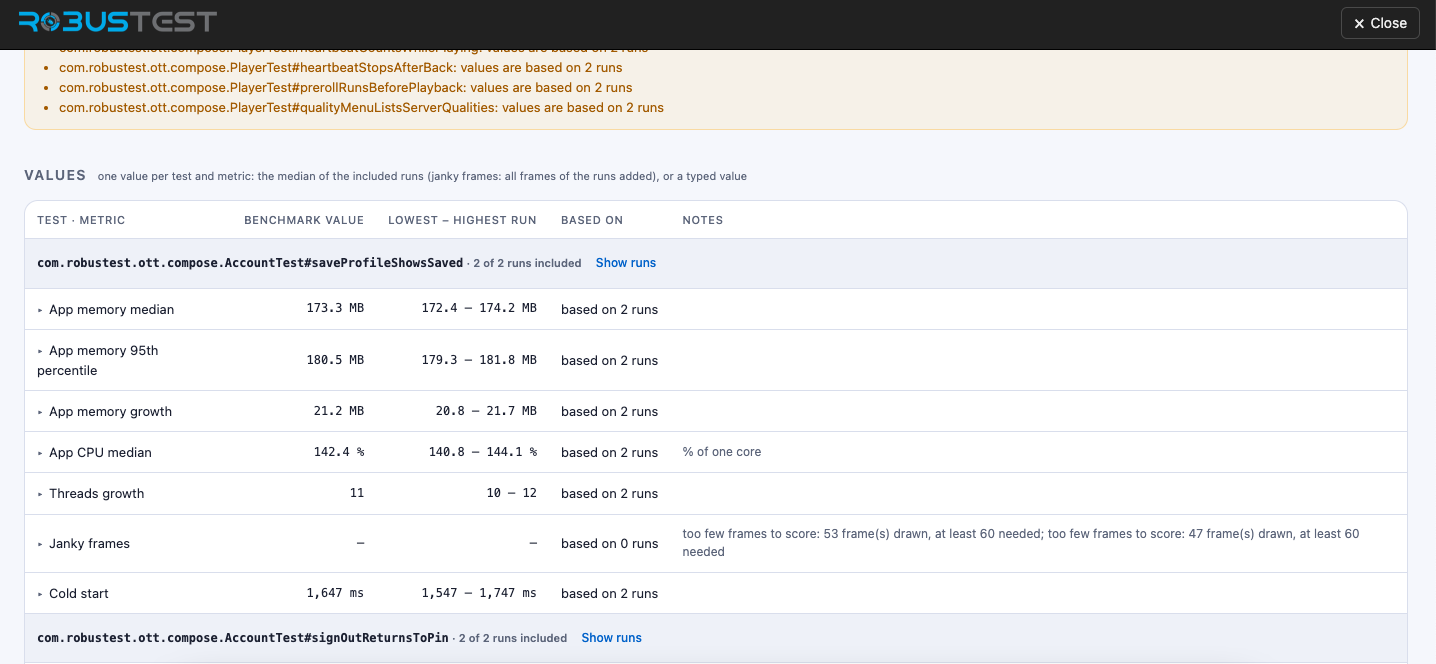
Each test case is a group, with a heading such as 2 of 2 runs included. Under it is one row per metric:
| Column | Meaning |
|---|---|
| Test · metric | The metric. The small arrow (▸) opens the value for each run. |
| Benchmark value | The value new builds are compared with. A typed value is marked as typed. |
| Lowest – highest run | The lowest and highest value among the runs it came from. A wide gap means the test varies a lot from run to run, so a tight limit may fail by chance. |
| Based on | How many runs the value comes from, for example based on 2 runs. |
| Notes | Anything to know, such as the unit (% of one core) or why a value is missing. |
Show runs (next to each test case) lists the runs behind its values with the job, build, device and date, and whether each run was Included or Left out.
A dash means no value. In the screenshot, Janky frames shows – and based on 0 runs, with the note too few frames to score: 53 frame(s) drawn, at least 60 needed. Janky frames needs at least 60 frames drawn in a run to give a reliable percentage. A test that barely draws anything on screen has no janky frames value, so a percentage check on janky frames is not compared for it (a fixed limit would still run).
Checks in this version and Version history
Scroll to the bottom of the page for the rules and the history.
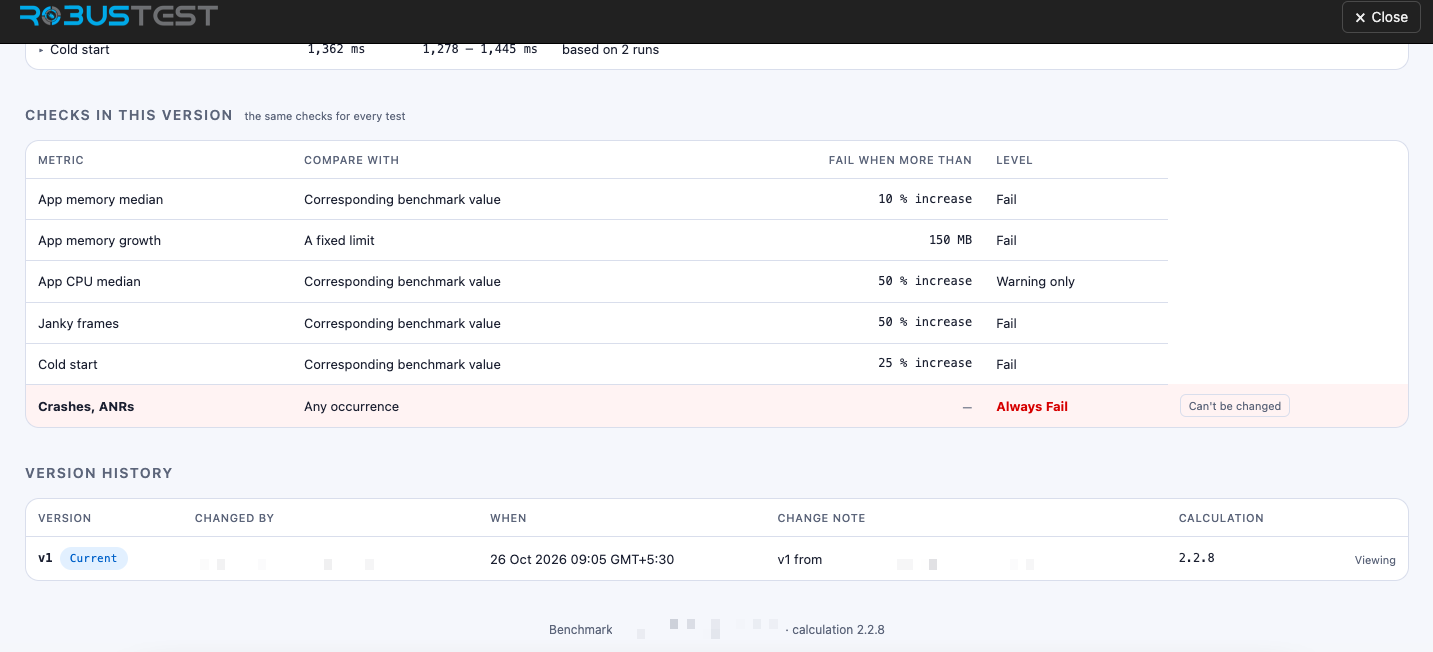
Checks in this version lists the checks that apply to every test in the benchmark ("the same checks for every test"):
| Column | Meaning |
|---|---|
| Metric | The metric that is checked. |
| Compare with | Corresponding benchmark value (a % increase over each test's own value) or A fixed limit. |
| Fail when more than | The limit — for example 10 % increase or 150 MB. |
| Level | Fail means a test that crosses the limit fails. Warning only (in the screenshot, App CPU median) means it is shown as a warning instead — this level only exists on benchmarks saved earlier; new ones only fail. |
| Crashes, ANRs row | Highlighted in red: Any occurrence → Always Fail. It applies to every benchmark and can't be changed. On iOS it covers crashes and hangs. |
These are the checks as they were when this version was saved, so they may differ from a later version.
Version history lists every version of the benchmark, newest first:
| Column | Meaning |
|---|---|
| Version | The version number. Current marks the latest version, the one new jobs use. |
| Changed by / When | Who saved the version and when. |
| Change note | The note written when the version was saved. This is why every edit asks for a note. |
| Calculation | The version of the calculation RobusTest used to work out the values (for example 2.2.8). If a job was measured with a different calculation, the job's notes say so and it is compared anyway. |
| Viewing | Marks the version you are looking at. Click any other version to open it. |
The line at the very bottom (Benchmark … · calculation 2.2.8) is the benchmark's ID. Support or an API call may ask for it.
Editing a benchmark and versions
Open a benchmark from the list and click Edit. You must write a short note in What changed and why before you can save — this is how the team keeps track of why a benchmark moved.
Every save creates a new version (v1, v2, v3…). Older versions are never changed or lost. Open Version history on the benchmark page to see who saved each version, when, and the change note, and to open any earlier version.
This matters for results:
- A job is compared with the version that was current when the job started. Saving a new version later does not change the results of jobs that already started.
- Deleting a benchmark isn't available on the benchmark pages. A project admin can do it through the API (
DELETE /v3/appvitals/benchmark/:id). A deleted benchmark is hidden from the list, but jobs that already used it still show their results.
Setting the default benchmark
Use Set as default on the list or on the benchmark page. A project has one default at a time; setting a new one replaces the old. A benchmark is never made the default automatically — not even the first one you create — so remember to set one. Without a default (and without a benchmark named in the Run Setting), jobs are not compared.
Choosing which benchmark a job uses
| Situation | Benchmark used |
|---|---|
| The job's Run Setting names a benchmark | That benchmark (it must belong to the same project and not be deleted). |
| The Run Setting names none | The project's default benchmark. |
| Neither exists (no default benchmark, and none named in the Run Setting) | No comparison happens. The job is Not compared ("no benchmark"). |
There is no benchmark picker in the Run Settings screen yet. To compare a job with a benchmark other than the default, add the benchmark's ID to the performance section of the Run Setting JSON (the ID is shown at the bottom of the benchmark page):
{
  "performance": {
    "enableAppVitals": true,
    "appVitalsBenchmark": "<benchmark id>"
  }
}
The Run Setting takes precedence over the project default. If the project has a default benchmark and the Run Setting also names one with appVitalsBenchmark, the job is compared with the benchmark named in the Run Setting, not the default. If you leave appVitalsBenchmark out, the project's default benchmark is used. The ID must belong to a benchmark of the same project that isn't deleted; otherwise the job shows Not compared with the reason.
Run Setting options that affect benchmarks
These options are in the Run Setting you use for the job. Set them before the job starts. To find them, open Run Settings from the Project Dashboard, open your Run Setting and go to the Performance section.
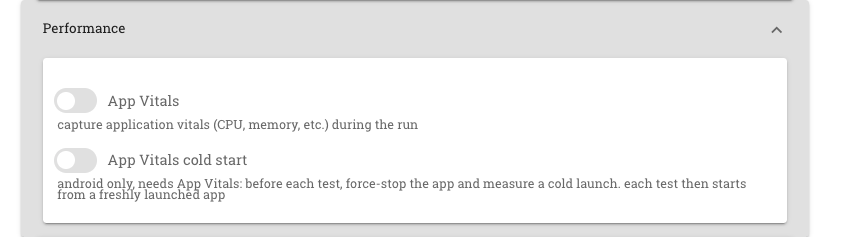
- App Vitals — switch it on so the job collects App Vitals. Without it, the job can't be compared with a benchmark.
- App Vitals cold start — Android (Espresso) only, and it needs App Vitals switched on. It is optional. Before each test, RobusTest force-stops the app and measures a cold launch; this is the only source of the Cold start value. Switch it on if your benchmark has a Cold start check. Each test then starts from a freshly launched app, so turn it on only where your suite is fine with that.
| Run Setting option | What it does | Needed for benchmarks? |
|---|---|---|
App Vitals (performance.enableAppVitals) |
Collects App Vitals during the run. Available for Android Espresso and iOS XCUITest jobs. | Yes. Without it the job isn't compared. |
App Vitals cold start (performance.appVitalsColdStart) |
Android only (Espresso), and needs App Vitals. Before each test, the app is force-stopped and a cold launch is measured. This is the only source of the Cold start value. Each test starts from a freshly launched app, so turn it on only where your suite is fine with that. | Optional — only for the Cold start metric. If it's off, Cold start is not captured and any Cold start check is Not compared. |
When the result appears
The comparison starts after the job has finished and the App Vitals data of every test has been processed. While it waits, the result shows Pending ("Comparing App Vitals with the benchmark"). This normally takes a short while. If some data is still missing after about 10 minutes, RobusTest compares what it has and marks the rest Not compared ("summary not ready").
Reading the result
Results
| Result | Meaning |
|---|---|
| Pass | At least one check was compared and every compared check was within its limit, with no crash, ANR or hang. |
| Fail | At least one test failed: a check was worse than its limit, or the app crashed (or had an ANR / hang). |
| Not compared | Nothing could be compared — see Why a test is not compared. |
| Pending | The comparison is still running. |
How the job result is decided:
- Each test gets its worst metric result. A test fails if any of its checks fails, or if it crashed. It passes only if a benchmark check was actually compared and passed — a test with no crash but nothing compared is Not compared, not Pass.
- The job fails if any test fails. Otherwise it passes if any test passed. If no test could be compared, it is Not compared.
What is counted:
- A crash, ANR or hang in any attempt of a test counts, even if the test passed on retry.
- For the value checks, RobusTest uses the last attempt of each run, and only runs that completed and passed. A failed run never decides a check.
Where to see it
| Place | What you see |
|---|---|
| Job dashboard | A performance chip at the top right with the result, the benchmark name and version. Hover for the test counts; click to open the Job performance page (see below). |
| Test Runs list | A small verdict icon in each row of a job with App Vitals (see below). |
| Job performance page | The full comparison: for every test case and metric, the benchmark value, this job's value, the change and the limit, plus notes and warnings. |
| Webhook | If the job has a REST webhook, it receives a second message with "event": "appVitalsPerformance" when the comparison is done. The first (job completed) message only carries status pending. |
On the job dashboard
Open a job from the Test Runs list. If it ran with App Vitals, a performance chip appears at the top right of the job dashboard, in line with the breadcrumb.
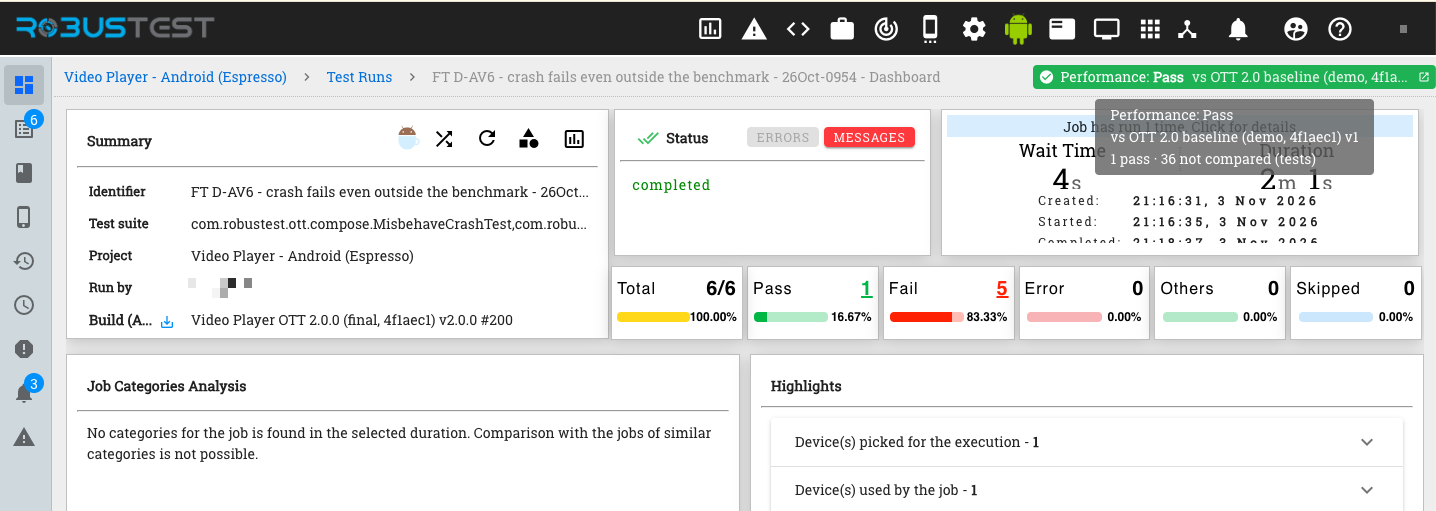
| Part of the chip | Meaning |
|---|---|
| Colour and word | Pass is green, Fail is red, Not compared is grey. While the comparison runs it shows a spinner and Pending. |
| vs … (benchmark name) | The benchmark the job was compared with. Hover to see the full name and the version (for example v1). |
| Hover tooltip | The result, the benchmark and version, and the test counts, for example 1 pass · 36 not compared (tests). |
| Open icon (at the right of the chip) | Click the chip to open the full Job performance page in a new tab. |
The counts in the tooltip are counted in tests. In this example the benchmark covers many tests but the job ran only a few of them. The ones the job didn't run count as not compared, and the one test that was compared stayed within its limits, so the job result is Pass. If you expect more tests to be compared, check that the job ran them and that they are in the benchmark.
A failed job looks like this. The chip turns red and reads Performance: Fail, and the tooltip lists how many tests failed.
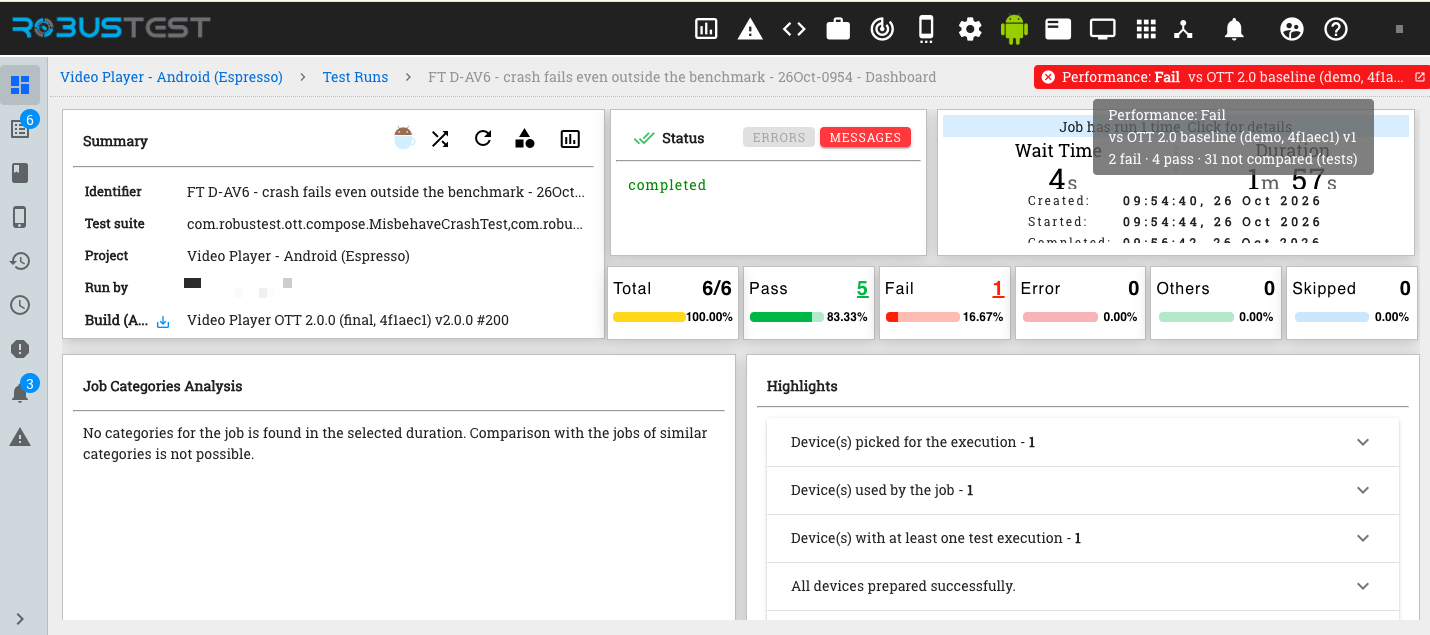
Here 2 fail · 4 pass · 31 not compared means two tests were worse than a limit (or crashed), four were within their limits, and 31 could not be compared (for example, benchmark tests this job didn't run). One failed test is enough to fail the whole job, even though most tests passed. Click the chip to see which tests and metrics failed.
Two different counts on one page. The boxes below the summary (Total, Pass, Fail …) count the job's test cases and whether they passed or failed. The chip counts tests against the benchmark, so the numbers differ. A job can pass all its test cases and still show Performance: Fail, or the other way round.
The chip updates by itself: a job that has just finished shows Pending and changes to the final result when the comparison is done.
In the Test Runs list
On the project's Test Runs page, every job that ran with App Vitals shows a small performance icon next to its status icons (highlighted in red below). It lets you spot a performance problem without opening the job.
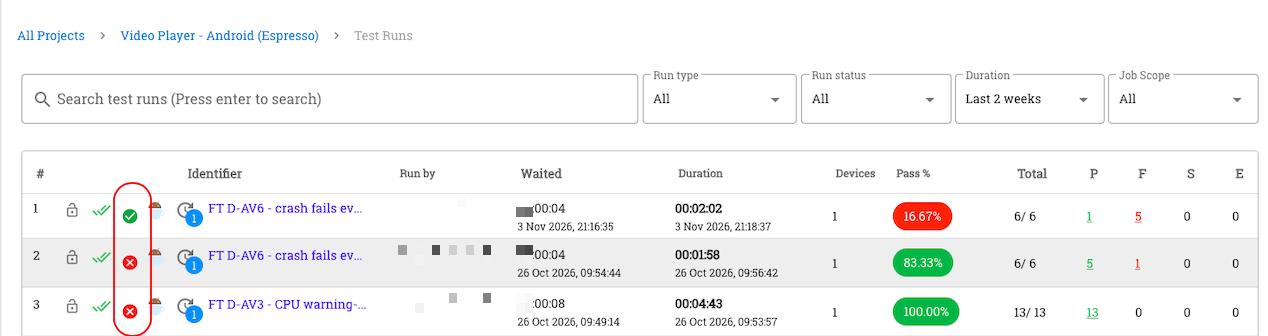
| Icon | Meaning |
|---|---|
| Green tick | Pass — within the benchmark. |
| Red cross | Fail — at least one test was worse than its limit, or crashed. |
| Grey minus | Not compared — nothing could be compared. |
| Spinning circle | Pending — the comparison is still running. |
| (no icon) | The job didn't run with App Vitals, so it isn't compared. |
Hover over the icon for a short summary (the benchmark and version, and the test counts). Click it to open the Job performance page in a new tab.
The performance icon is separate from the test result. The Pass % column tells you whether the tests passed; the performance icon tells you whether the app's performance stayed within the benchmark. In the screenshot, the first job has a low pass rate (16.67 %) but a green performance tick, while the second job passed 83.33 % of its tests but has a red cross, because a test was worse than its limit or the app crashed. Read both.
On the Job performance page
Click the chip (or the icon in the Test Runs list) to open Performance comparison for the job. This is where you find out what went wrong. The breadcrumb links back to the job and to the benchmarks, and the JSON button opens the same data as the API returns.
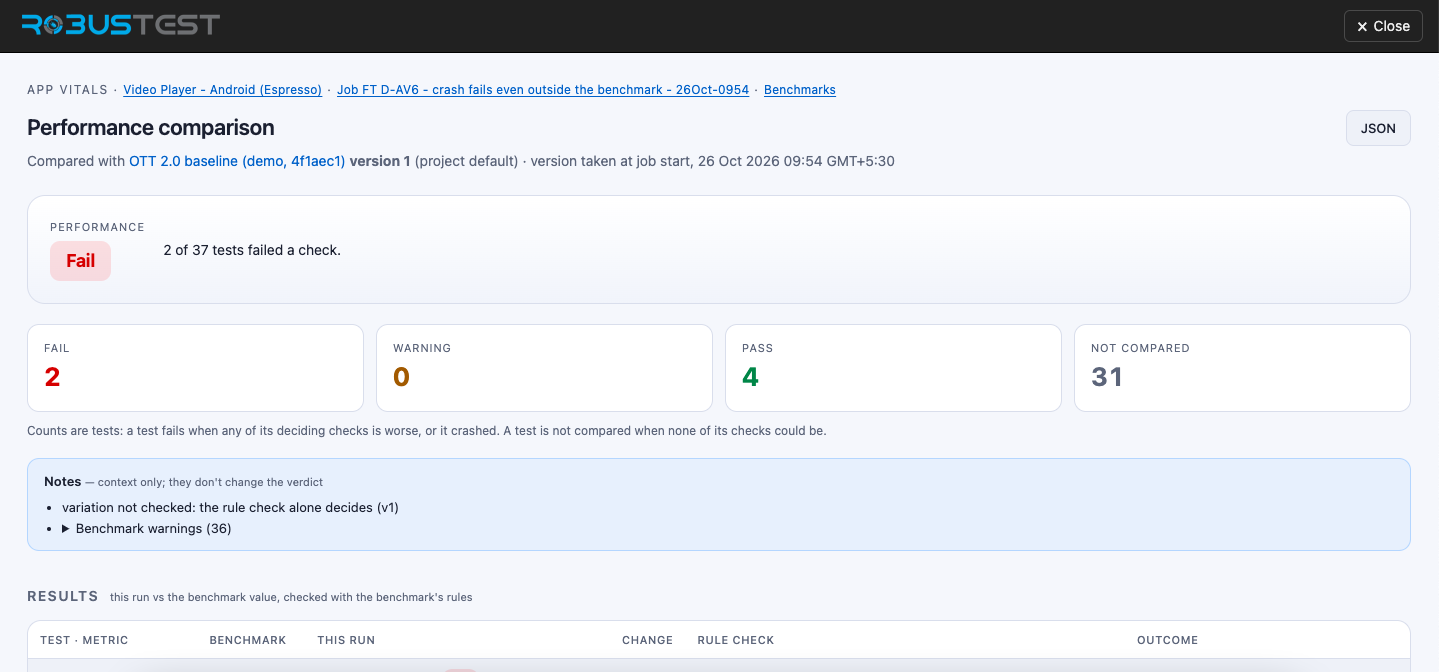
| Part of the page | What it shows |
|---|---|
| Compared with … (under the title) | The benchmark and its version, whether it was named in the job's Run Setting or is the project default, and when the version was taken (job start or job completion). Click the name to open that exact version. |
| Performance box | The result — Pass, Fail, Not compared or Pending — with a one-line reason, for example 2 of 5 tests failed a check. While the job is running or waiting for its data it says The job has not finished or Waiting for App Vitals summaries, and the page checks again every 10 seconds by itself. |
| Fail / Warning / Pass / Not compared counters | How many tests fall in each group. A test fails when any of its checks is worse than its limit, or it crashed. |
| Notes | Context that never changes the result, for example runs that were left out, low coverage, or checks skipped on iOS. Benchmark warnings (N) expands the warnings saved with the benchmark version. |
| Results | The compared tests, worst first. Each test is a heading with its result and an open run link to its App Vitals report, followed by one row per metric (table below). |
| Not compared | Tests that could not be compared, each with the reason (see Why a test is not compared). These are never counted as Pass. |
Each row of the Results table:
| Column | Meaning |
|---|---|
| Test · metric | The metric, for example App memory (typical). Crashes, ANRs and hangs are shown in bold. |
| Benchmark | The benchmark value for this test case. |
| This run | This job's value. |
| Change | How far this run is from the benchmark value, with the percentage underneath. |
| Rule check | What the check decided: Not worse or Worse with the limit (for example limit 10 % increase over the corresponding benchmark value), or Within the limit / Over the limit with the numbers (for example 1,566 ms > limit 600 ms) for a fixed limit. Crash, ANR and hang rows say Always decides. |
| Outcome | Pass, Fail or Not compared for that metric, with the reason when it isn't a pass. |
Reading a failed result — an example
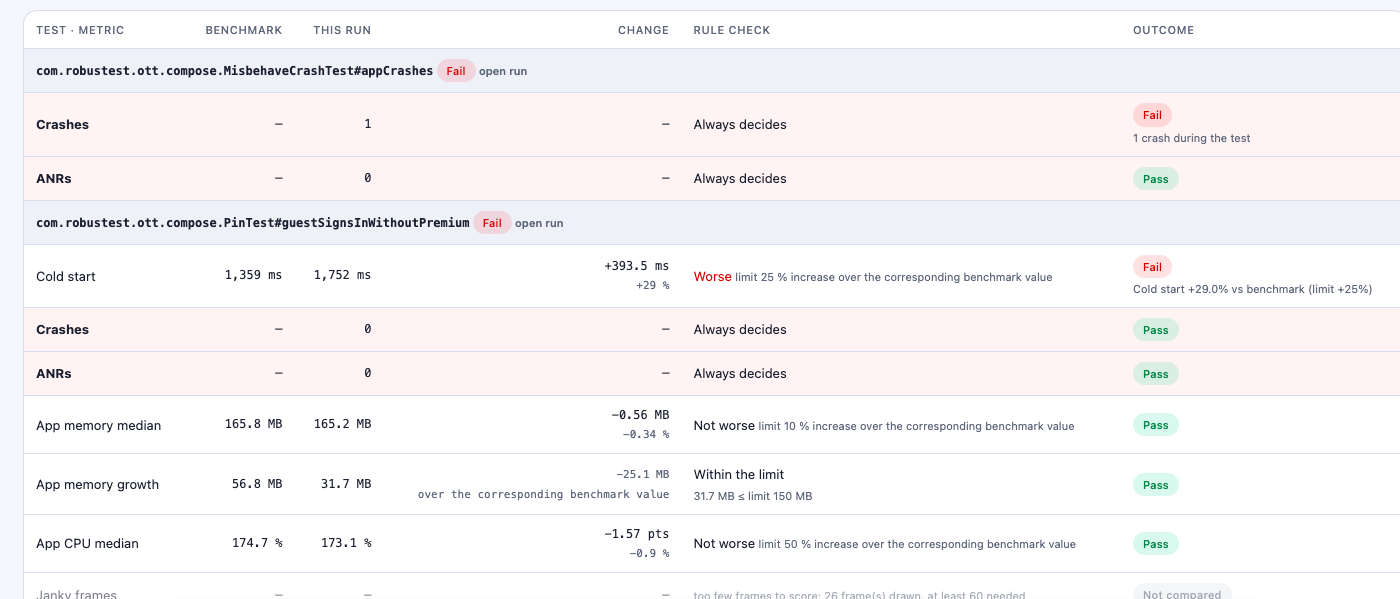
The top of the page above says Fail — 2 of 37 tests failed a check, so the Results table lists the two failed tests first:
MisbehaveCrashTest#appCrashesfailed because of a crash. The Crashes row shows 1 for this run, its Rule check says Always decides, and its Outcome is Fail with 1 crash during the test. A crash fails a test whatever the benchmark holds, which is why the Benchmark column shows –.PinTest#guestSignsInWithoutPremiumfailed because of Cold start. The benchmark value was 1,359 ms and this run took 1,752 ms: +393.5 ms, +29 %. The check allows at most a 25 % increase, so the Rule check says Worse and the Outcome is Fail (Cold start +29.0 % vs benchmark (limit +25 %)).
The other rows of that second test are Pass — memory and CPU are not worse than their limits, and App memory growth is within the limit (31.7 MB ≤ limit 150 MB). One failing metric is enough to fail the test.
The last row, Janky frames, is greyed out and Not compared: too few frames to score: 26 frame(s) drawn, at least 60 needed. A metric that isn't compared never counts as a pass or a fail.
To investigate a failed test, read its metric rows to see which metric crossed its limit and by how much, then click open run to see the App Vitals report for that run (graphs of memory, CPU, frames and so on).
If the job has no result, the page says No performance result for this job: App Vitals was off for it, or it ran before benchmarks existed.
Why a test is not compared
A test shows Not compared, with the reason, when:
| Reason | What to do |
|---|---|
| Test not in the benchmark (new or renamed test) | Add the test case to the benchmark. |
| Test not run in this job | Nothing — the benchmark has a test the job didn't run. |
| No App Vitals capture for this run | Check that App Vitals was on and the test ran long enough to capture. |
| Summary not ready / capture could not be read | Open the job again later, or check the App Vitals report for that run. |
| The test did not complete / did not pass | Fix the test; failed runs are not used for value checks. |
| No benchmark value set for this metric | Type or calculate a value, or use a fixed-limit check. |
| Benchmark value is 0 | A percentage can't be worked out from 0 — use a fixed-limit check. |
| Android vs iOS | The run is from a different platform than the benchmark. |
Some metrics are skipped on purpose and listed in the notes, for example janky frames and cold start on iOS (not captured yet), and hangs on iOS unless the device log stream is on (crashes are still checked).
Good practice
- Build the benchmark from a build you trust, ideally from 3 or more runs of the same test on the same device model.
- Use percentage checks for noisy metrics (memory, CPU) and fixed limits for targets (cold start).
- Start with a loose limit and tighten it as you learn how much your app normally varies. Every change is a new version, so you can always see what changed.
- Keep one default per project and name other benchmarks (for example per release) in the Run Setting only when needed.
- Read the warnings on a benchmark. Few runs, runs from different devices, or low coverage mean the value may not be reliable.
API reference
All endpoints need a logged-in user or access key. Changing a benchmark needs a project admin.
| Method | Endpoint | Purpose |
|---|---|---|
GET |
/v3/project/:id/appvitals/benchmarks |
List the project's benchmarks. |
POST |
/v3/project/:id/appvitals/benchmarks |
Create a benchmark (version 1). |
GET |
/v3/appvitals/benchmark/:id |
Get a benchmark (current version). |
PUT |
/v3/appvitals/benchmark/:id |
Save a change as a new version. |
DELETE |
/v3/appvitals/benchmark/:id |
Delete a benchmark. |
POST |
/v3/appvitals/benchmark/:id/default |
Make it the project default. |
GET |
/v3/appvitals/benchmark/:id/versions |
Version history. |
GET |
/v3/appvitals/benchmark/:id/version/:v |
One specific version. |
GET |
/v3/project/:id/appvitals/benchmark-testcases |
Test cases of the project with their App Vitals attempts. |
GET |
/v3/job/:id/appvitals/performance |
The job's full performance comparison. |
GET |
/v3/job/:id/status |
Includes a performance block: status (pending, done, timedOut), verdict (fail, pass, notCompared), benchmark name and version, and test counts. |
The job performance page is at /appvitals/job/<job id>/performance.